Solar energy output is predominantly affected by seasonal solar variations and weather. The angle of the sun to the solar panel changes with the time of day and seasonal variations, changing the available solar resource in predictable ways. Weather also affects the available solar resource, but is much less regular and can vary widely in both temporal and spatial scales.
Regional weather patterns can significantly increase solar variability during specific times of the year. An example of a regional weather phenomenon that can dramatically impact solar energy production in the Southwest United States is the North American Monsoon.
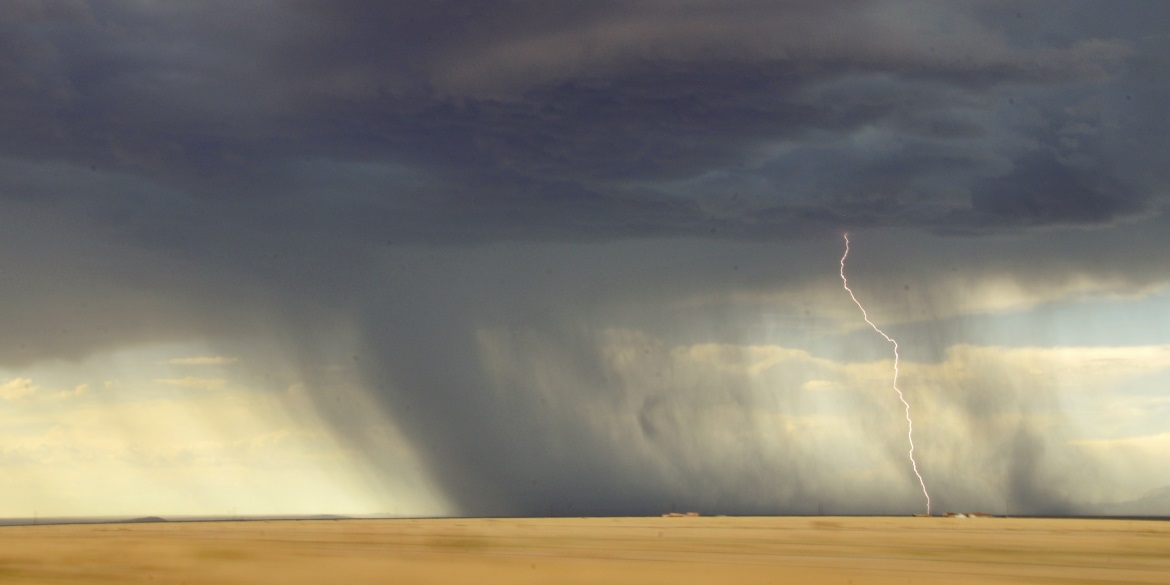
The North American Monsoon is a regional-scale circulation pattern associated with a dramatic increase in cloud cover and rainfall that occurs over what is normally an arid region of the Southwest. The North American Monsoon typically occurs during July through September, and affects several states including Arizona, New Mexico, Utah, Colorado and Southern California.

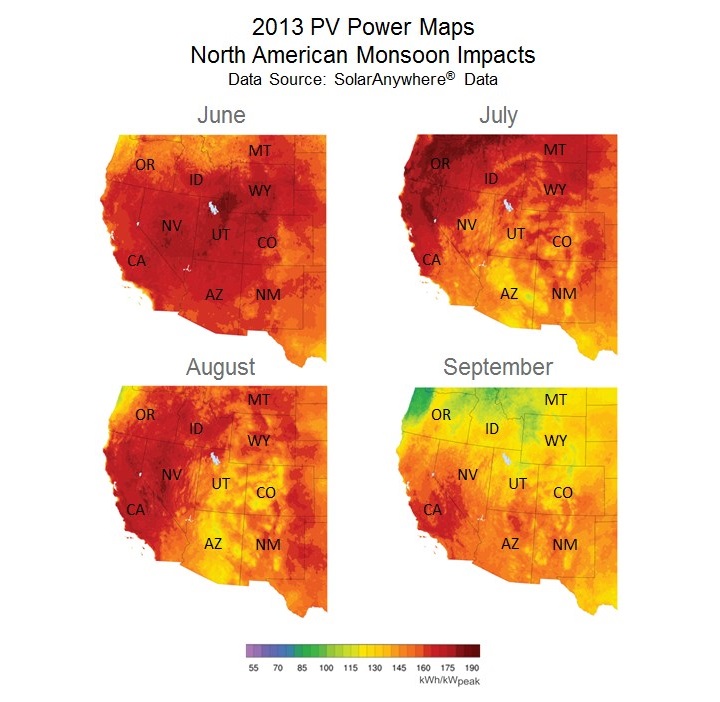
As indicated in the PV Power Maps above, in 2013, the North American Monsoon started on the early side in late June, and extended well into September. Several regions in Arizona received record monsoon-associated rainfall over this time period. The 2013 season culminated with September rainfall events in Northern Colorado that were both tragically deadly and record setting.
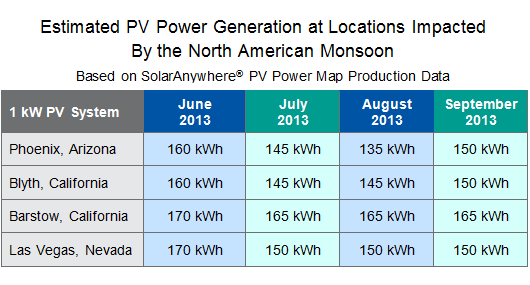
The North American Monsoon also impacted solar energy production. While near normal for the region in June, a significant reduction in PV energy generation was observed in both July and August. Arizona experienced the largest reduction in PV energy generation, but regions such as the Mojave Desert and Imperial Valley of Southern California, along with the Southeastern portion of Nevada, also experienced sizeable reductions.
As illustrated in the chart below, simulated 1 kW PV systems at four locations in the desert Southwest experienced fairly noticeable drops in energy production in July and August, with higher energy production observed in September as the North American Monsoon impacts began to wane.

Using PV Power Maps to gauge variability
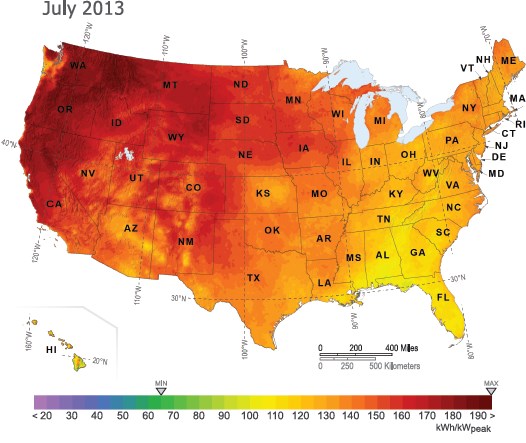
PV Power Maps make it easy to estimate what the output of a solar system might be in your area for any given month. Simply pinpoint your location on the map, refer to the color chart to determine that month’s PV power output, and multiply that number by the kW value of your system.
To understand the production potential of a planned PV system, analyze a year or more of data to account for month-to-month variability due to seasonal changes and other factors. To gauge potential power output over time, you can access maps of the United States going back nearly two years at the Solar Today blog, or in Resources on the Clean Power Research website. You can also access historical solar resource data for specific locations, free of charge, at www.solaranywhere.com.

About PV Power Maps
Full coverage PV power maps for the United States are featured in Solar Today, and can be found online at solartoday.org/pvpowermap. The Solar Today PV Power Maps are created from power production data generated by Clean Power Research using SolarAnywhere irradiance data and simulation services. The maps depict the amount of electricity that could have been generated by a nominal 1-kilowatt (kW) photovoltaic (PV) system on a monthly basis. You can learn more about the maps and how to use them in the article, ‘PV Power Maps: visualizing monthly production.’
