When it comes to ensuring that solar investments live up to power-production expectations, one important element is understanding the uncertainty of the solar resource. The lower the uncertainty of the background solar resource, the higher the likelihood a solar system will meet or exceed forecasted production over the life of the system. This is important not only to developers of utility-scale projects who need to finance their projects, but also for owners of fleets of distributed PV systems who are looking to securitize their portfolios.
Commonly used solar resource datasets include:
- Typical-meteorological-year (TMY3) data, available from the National Renewable Energy Laboratory (NREL), and
- Satellite-derived measurements, such as SolarAnywhere® Data.
To see how energy calculations derived from these two data sources compare, let’s look at an example from the Minneapolis/St. Paul region in Minnesota.
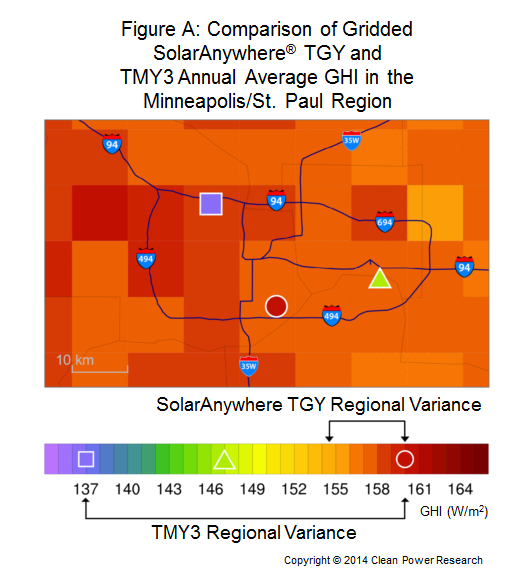
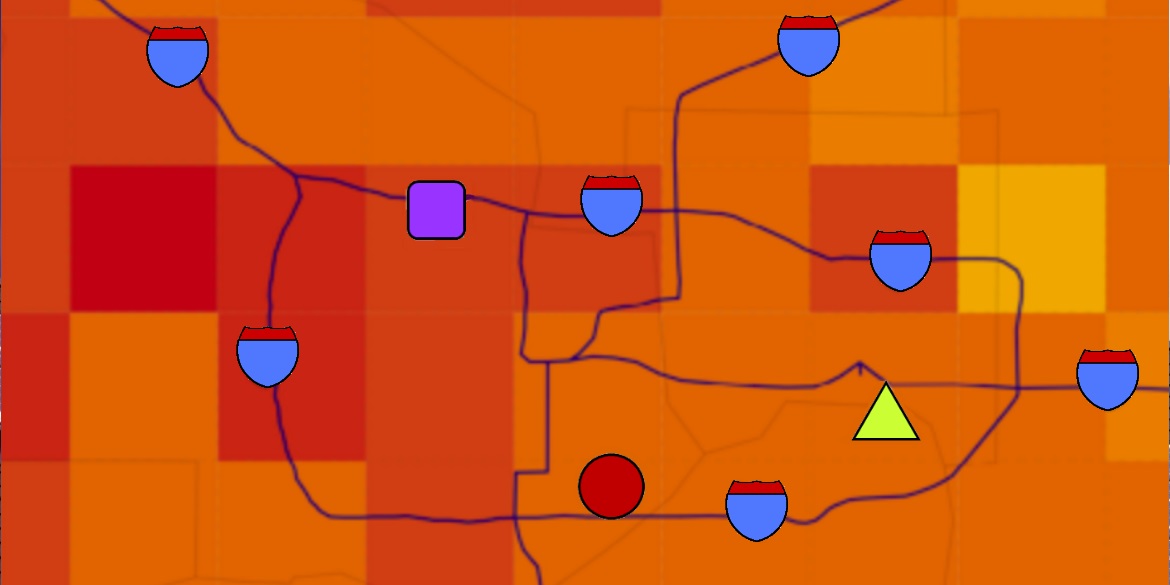
Figure A illustrates the spatial variability of the solar resource in this region. In this figure, the annual average global horizontal irradiance (GHI) at the three TMY3 locations in Minneapolis/St. Paul (represented by a purple square, red circle and green triangle) are superimposed on gridded SolarAnywhere typical-GHI-year (TGY) 10 km data (the orange to red tiled background of the image).

As can be observed, there is a much larger TMY3 GHI variance than that seen in the SolarAnywhere satellite-based GHI. The high GHI variance observed across the TMY3 data is due to atypical reference months being chosen during NREL TMY3 processing.
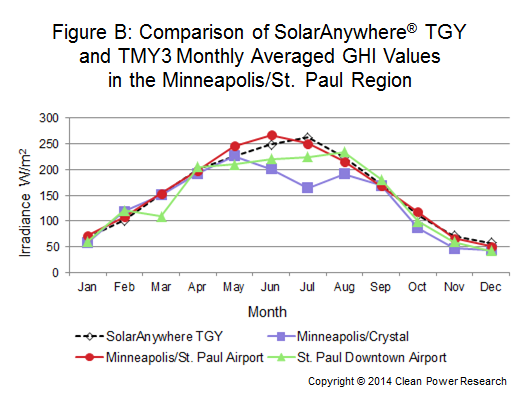
Figure B shows monthly averaged GHI values from the baseline SolarAnywhere TGY (black line) and three TMY3 (red, green and purple lines) datasets.

The Minneapolis/St. Paul Airport TMY3 (Class I site) profile is similar in shape to the baseline SolarAnywhere TGY profile. The other two TMY3 datasets (Class II sites) are populated with below average summer months, resulting in lower overall reported GHI at the non-airport TMY3 locations.
It is likely the TMY3 site classifications are the source of this discrepancy in GHI resource. Class I TMY3 sites are based on 24 years of data, while Class II and III sites utilize just 12 years of data, resulting in a higher chance of outlier months being selected in the TMY3 data processing methodology.
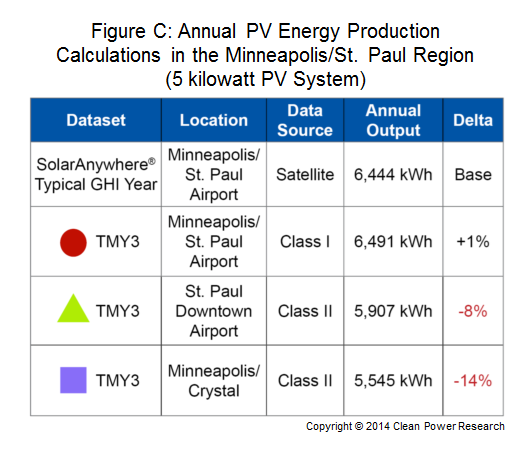
Figure C shows how this GHI variance translates to annual PV energy calculations in the Twin Cities. In this case, variance in PV energy simulations is as much as 15 percent due to the inclusion of atypical reference months for two of the three TMY3 sites.

The satellite-derived data in SolarAnywhere applies a consistent methodology across a spatially coherent dataset (in this case, 10 km) to provide reliable PV energy production calculations. Lower uncertainty reduces risk for solar investors.
SolarAnywhere satellite-based irradiance data is available in resolutions as low as 1 km, and in a variety of formats, including time-series and typical GHI and DNI year (TGY and TDY). Typical-year datasets are based on historical measurements from 1998 to as recent as the last completed month, offering assurance that the most up-to-date weather conditions are factored into calculations.
