PV fleet forecasts
Solar forecasts are traditionally concerned with predicting the output of solar PV systems at particular locations. Consequently, much of what is known about solar forecast accuracy is centered on point validations. Fleet forecasts consider the aggregated output of all PV systems interconnected in a given region and affecting the regional power grid. Many of these PV plants are user-sited, behind-the-meter plants. Fleet forecasts are particularly relevant for independent system operators (ISOs) who need them for load forecast purposes.
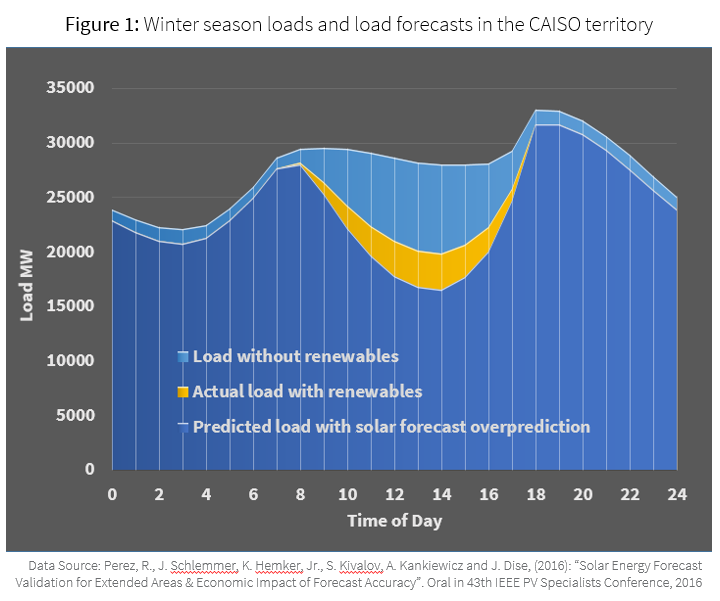
Figure 1 shows that utility loads are increasingly shaped by the aggregated generation of interconnected PV plants. Knowing this shape—a.k.a. the “Duck Curve”—in advance is essential for grid operators.

How good are state-of-the-art PV fleet forecasts?
A recent research paper by Perez et al. investigates the influence of a PV fleet’s regional footprint on the accuracy of SolarAnywhere® FleetView® forecasts from one-hour ahead to 48 hours ahead. Considered regional footprints range from a single point (i.e., a single power plant), to a dispersed PV fleet’s region the size of California.1
The article considers two climatic regimes: semi-arid and humid continental. The regions investigated for each regime are centered respectively on the National Oceanic and Atmospheric Administration (NOAA) sites of Desert Rock, Nev., and Bondville, Ill.
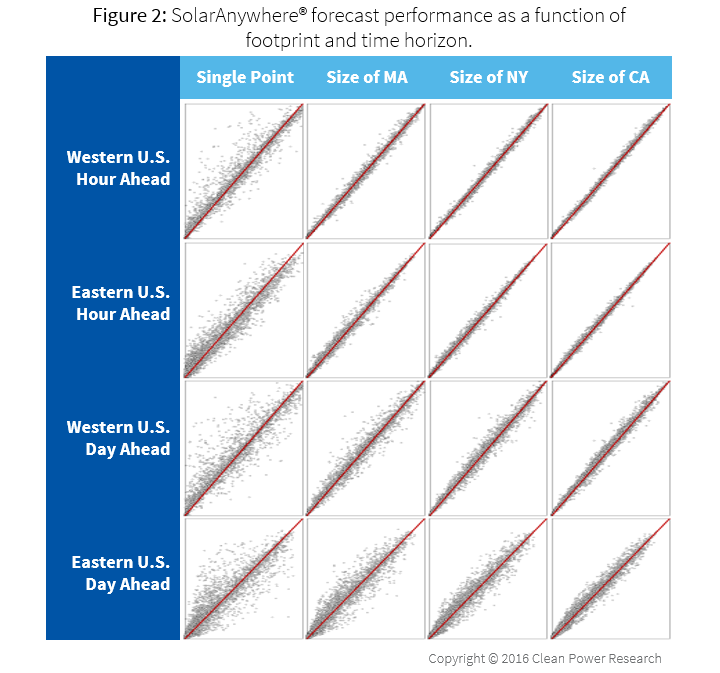
Figure 2 illustrates the impact of a PV fleet’s footprint on forecast accuracy in the Eastern and Western U.S. for one and 24 hour time horizons. Forecasted hourly irradiance (y-axis) is plotted versus measured, hourly, satellite-based irradiance (x-axis). Four dispersed PV footprints are illustrated, and represent respectively a single plant, and regions the size of Massachusetts, New York State, and California. The figure is based on one full year of hourly data.

The results show that the uncertainty of single plant forecasts is generally good, but that the probability of a miss, either on the high side or the low side, is not negligible, particularly for day-ahead forecasts in cloudy Eastern U.S. locations. There is a significant reduction in uncertainty as the footprint of the fleet increases.
SolarAnywhere® v4 fleet forecasts, at the scale of ISO territories, are remarkably accurate. Therefore, these forecasts can be applied reliably by ISOs for load forecasts, and effectively inform energy markets, power plant commitments and load following operations.
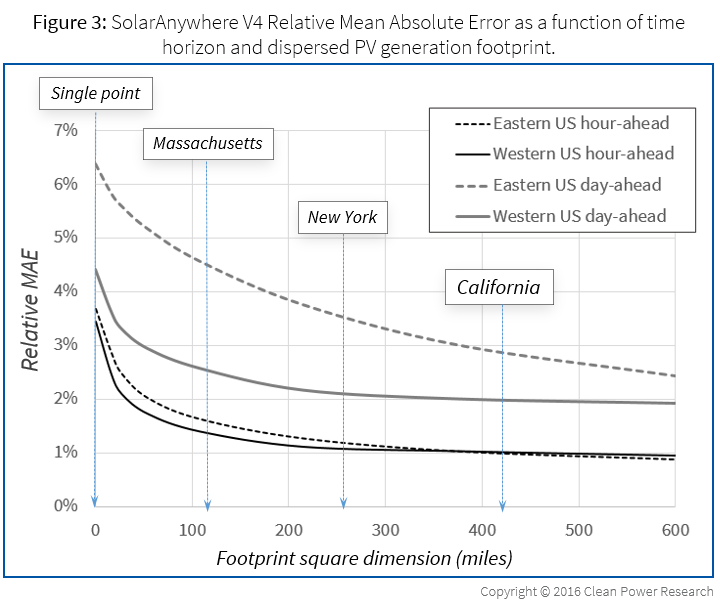
A quantitative summary of the scatterplots is presented in Figure 3. The relative mean absolute percent error (MAE) of SolarAnywhere forecasts is plotted versus dispersed PV generation footprint. Relative MAE is normalized to 1,000 W/m2 (i.e., rated PV capacity).
For both Eastern and Western locations, hour-ahead errors on the order of 1% of rated capacity are rapidly achieved for distributed footprints exceeding 100×100 km. Day-ahead errors rapidly drop to ~2% for the Western locations, while the decrease is more gradual in the east. These results imply that an ISO such as NYISO could count on service-wide distributed PV forecast accuracies of ~1% for hour-ahead, and 3.5% for 24 hours-ahead forecasts.
Key take aways
- The accuracy of solar irradiance forecasts—and therefore the accuracy of PV forecasts—is strongly dependent on the footprint of the considered PV fleet.
- For footprints of concern to independent system operators, the accuracy of SolarAnywhere v4 is operationally satisfactory. System operators interested in validating PV forecasts should focus on fleet forecasts covering areas relevant to their operations and not on single plants.
- In a following blog, we’ll present data comparing the performance of SolarAnywhere v4 to its underlying models, including cloud motion vectors and NWP models. We will also discuss the economic impact of missed forecasts from first principles.
1Recall that in a previous blog we discussed how regionally-extended regional forecasts could be precisely validated using historical satellite data when no measured PV production data are available.
You can read more about this topic in the paper “Solar Energy Forecast Validation for Extended Areas & Economic Impact of Forecast Accuracy.”
