What it means to PV plant owners and developers
For many solar PV plant owners in the U.S., solar energy production in the last year or two has fallen well below expectations. We’ve heard this again and again recently. Maybe you’ve heard the same thing.
What’s causing the energy shortfall? Are there widespread equipment or maintenance issues? Is a streak of bad weather to blame? Are the energy models or weather data used for financing too optimistic? Creating a plan to mitigate or correct the shortfall requires understanding what caused it.
We used SolarAnywhere® to see if we could identify what’s driving these reports and consider what that means for the future. Let’s look at the data.
Visualizing insolation trends
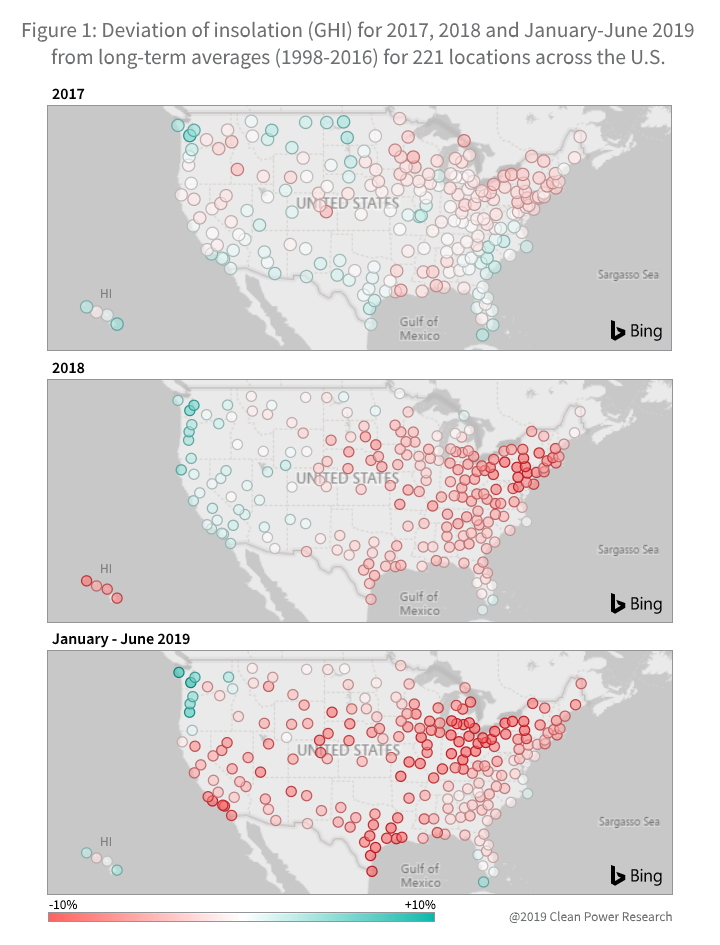
Using SolarAnywhere insolation data, we created maps (see Figure 1) showing how solar insolation from January 2017 to June 2019 deviated from long-term averages (1998-2016) for 221 locations across the United States. Global horizontal irradiance (GHI) is used because it’s a useful proxy for solar energy production when talking broadly about solar PV or if the specifics of the plants are unknown. Green dots mean the location had above average insolation. White is neutral and red is below average.

Interpreting the solar data numbers
2017 solar insolation was in line with historical trends. Some locations were above average, and some were below. Deviations were moderate—within +/- 5% for most locations. Compare that to 2018 when the Eastern U.S. and Hawaii received well-below-average insolation, while the West saw above-average insolation.
What about the start of 2019? There’s a lot of red. Notably the big solar state of California has been 5-10% below historical averages for the first six months of 2019. We expect some moderation in the deviations for the full year (regression toward the mean), but the recent trend of lower-than-average insolation has continued.
Some locations such as the Northeast will have had two plus years of sub-par performance. Much like flipping a coin twice and getting tails both times, that’s not unusual. In general, we expect any given year to fall above or below the typical year or P50 with equal probability. But given the strength of the deviation, it’s clear why people have been looking for answers.
What about the magnitude of the deviations—are these typical? The deep red dots represent a deviation in excess of -10%. Prior studies of interannual variability suggest these were less than 1% probability weather events (i.e., less than P99). In fact, the stretch of weather from 2018 to present looks unprecedented.
What other weather experts are reporting
Many others have reported on the anomalous weather. According to NOAA’s retrospective on 2018, nine Eastern states had their wettest year on record. With precipitation records dating all the way back to 1895, these were by definition less than one in one-hundred year, or P99, weather events. While not a one-to-one correlation, more rain generally means less sun on the ground.
What’s more, the record-breaking rainfall has extended through the spring of 2019. NASA declared the 12 months through April the wettest on record. Precipitation in the lower 48 states was 17% above average.
Ken Kunkel, a NOAA climatologist, discussed what to make of the weather: “I do not have an explanation for the weather systems that caused the heavy precipitation, but sea surface temperatures in the western Atlantic and Gulf of Mexico have been generally well above normal over the past year. This has surely added to the atmospheric water vapor content available to the precipitating weather systems. The pattern of precipitation over the past 12 months indicates general wetness over most parts of the U.S. but does not match projections of the future, which show increases mostly in the northern U.S. Thus, the recent wetness probably has explanations in addition to, or instead of, just anthropogenic forcing.”
Implications for the solar industry
What are the implications for the solar industry? First, the data above show that historically anomalous weather over this period can explain the widespread reports of solar production falling below expectations. Crucially, this finding allays concerns about the condition of plants themselves and the models used to project long-term project economics.
Second, weather data used for project financing, acquisitions, interannual variability studies, etc., must be up to date. For example, Clean Power Research recently released an updated SolarAnywhere Typical Year dataset that includes data from 1998 through 2018. In some areas, including irradiance data for 2017 and 2018 reduces the estimated solar resource by around 1%. While the amount will be notable to solar developers, the good news is that the recent weather is immaterial in comparison to the extremely compelling and continually improving economics of solar overall.
Finally, plant owners and operators can use historical and real-time irradiance data to put recent production in context. SolarAnywhere SystemCheck®, for example, is used by our customers to create weather-corrected performance ratios for many hundreds of thousands of solar systems in near real time. Removing the weather variable lets operators identify equipment and maintenance issues faster and reduce unnecessary O&M expenditure.
If you’ve found the information in this blog valuable, contact us to discuss how SolarAnywhere can improve the speed and quality of your solar decisions.
Appendix: Monthly view of insolation deviation
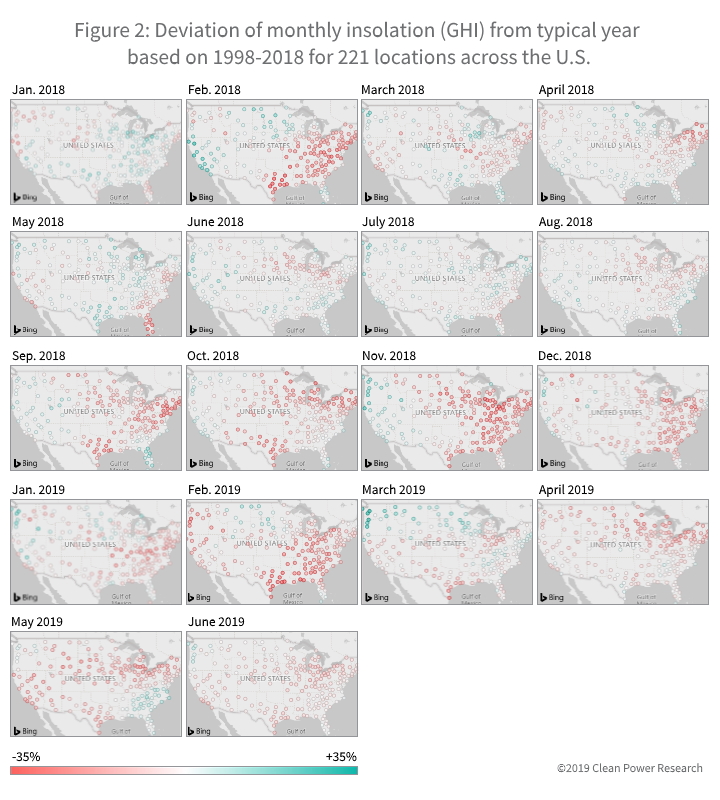
Analysis of the monthly data as shown in Figure 2 lets us examine how individual weather events (e.g., hurricanes) might have affected solar production. Deviation of monthly insolation from typical year based on 1998-2018 is shown for January 2018 through May 2019.

