PV soiling losses can increase the levelized cost of electricity (LCOE) of solar power plants by as much as one cent per kWh, depending on the project site. With the average LCOE of solar generation expected to decrease to 1-5 cents/kWh globally by the year 2050, the risk from soiling losses is becoming increasingly significant.
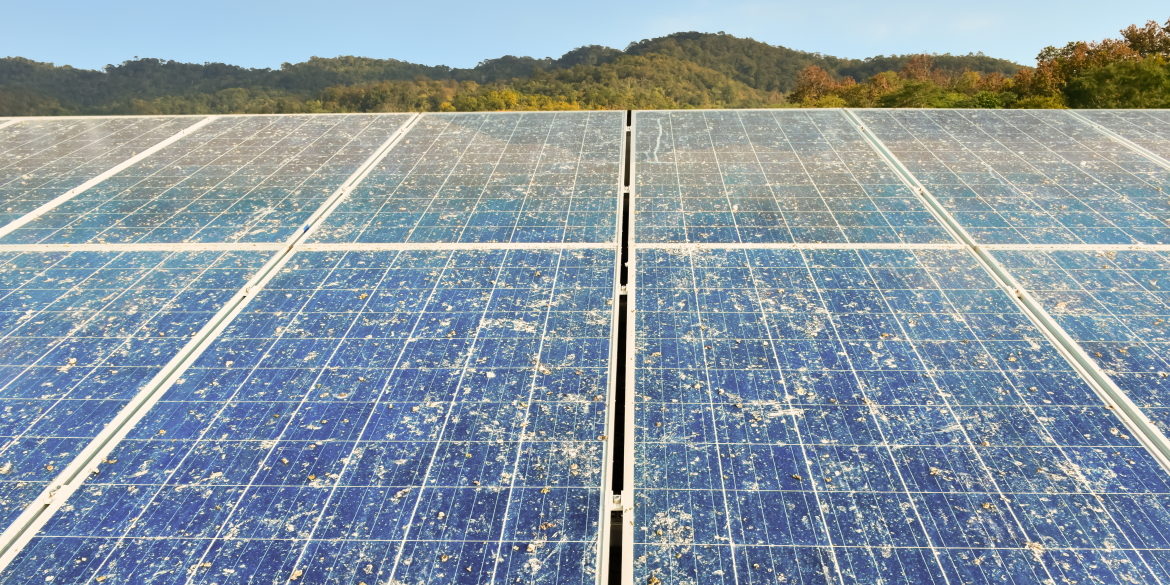
Soiling loss is defined as the energy loss due to the accumulation of dirt, dust and organic/inorganic contaminants on PV panels. Module soiling can increase the LCOE of solar plants in two ways: first, by reducing available power output; and second, by increasing PV performance uncertainty and financial risk.
To address these issues, site-specific soiling loss estimates are now available in SolarAnywhere®, enabling solar owners and operators to reduce uncertainty and accurately diagnose real-world issues causing PV underperformance.
PV soiling losses a key driver of solar production uncertainty and risk
Depending on the project location and system configuration, soiling can be a significant source of PV production uncertainty and financial risk. Studies have shown that PV soiling losses can contribute anywhere between 1-4% of the uncertainty (1-sigma) in P50 energy production estimates. Accurately predicting PV soiling losses can be difficult: a study in the kWh Analytics Solar Risk Assessment 2021 report found that solar stakeholders are consistently misestimating the impact of soiling on PV generation, and hence increasing revenue risk.
A key challenge in accurately estimating soiling losses is that they are highly site-specific. Since local weather is always in flux—changing from season to season and year to year—soiling losses can exhibit high seasonal and inter-annual variability. Consequently, soiling losses can vary widely between locations. NREL has estimated that annual PV soiling losses can range from zero to 7% in the U.S. and reach as high as 50% in certain parts of the world.
So how can project developers, owners and financiers reliably estimate PV production risk due to soiling?
Site-specific soiling loss estimates using SolarAnywhere
In a study evaluating the impact of various environmental and meteorological parameters such as precipitation and wind speed on PV soiling losses, NREL found that particulate matter (PM) data—primarily PM10 and PM2.5—has the highest correlation with soiling losses.1 Until now, research and large-scale validation of soiling loss models that incorporate particulate matter data has been limited. This is due in part to the relative difficulty accessing up-to-date, site-specific particulate matter data.
To support soiling loss modeling and research, SolarAnywhere offers PM10 and PM2.5 particulate matter data globally—the first offering of its kind. Now, we’re making it easier than ever to get data-driven, site-specific soiling loss estimates, on-demand, via the SolarAnywhere API. SolarAnywhere soiling loss calculations combine high-fidelity weather data, including particulate matter data, with community-trusted soiling loss models such as the pvlib Humboldt State University (HSU) model, to estimate the impact of soiling on PV generation.2,3
Global, on-demand access to soiling loss estimates enables solar developers and owners to easily identify project locations with increased soiling risk. Site-specific, long-term monthly soiling loss averages (e.g., 12×1) can be used with energy modeling programs such as PVSyst and PlantPredict to reduce uncertainty in PV production estimates, thereby reducing financial risk to PV projects. In addition, the SolarAnywhere API makes it easy to model and compare soiling losses for different system configurations. This can be useful for optimizing system design and maximizing PV performance and project revenue.
Global soiling loss map illustrates highest-risk regions
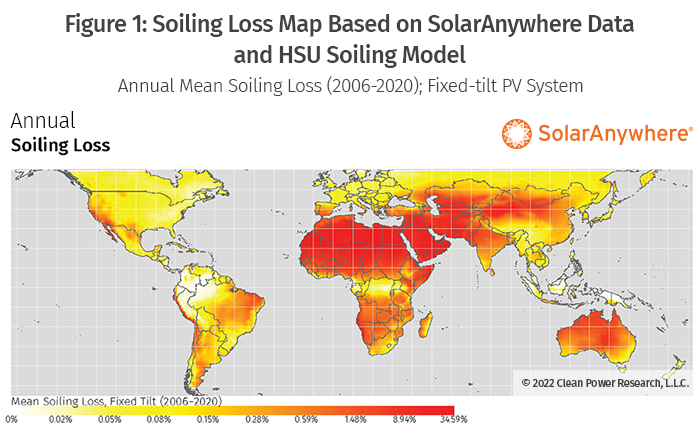
To illustrate the value of these global modeling capabilities, we generated a global soiling loss map using the HSU soiling loss model and SolarAnywhere historical time-series weather data from 2006-2020. An arbitrary utility-scale (50MWdc) fixed-tilt PV system was considered for this analysis. Natural precipitation is used as the primary and sole source of dust removal in the HSU model. On-demand, global access to PM10 and PM2.5 particulate matter data in SolarAnywhere could support the development and evaluation of other soiling models as they become available.
The map in Figure 1 shows that for panels that are not cleaned manually, soiling losses can reach as high as 35% in northern Africa and the Middle East. This is due to the prevalence of high particulate matter (such as dust and sand) and low precipitation in the area. This trend is confirmed in a study by Li et al that reported capacity factor reduction of more than 30% in the Middle Eastern and Saharan regions, despite their abundance of available solar resource.
Modeled versus measured soiling loss data
Calculating how much production uncertainty is driven by soiling can help determine if further due diligence, such as installation of on-site soiling stations, is necessary to accurately quantify potential PV generation risk. For some utility scale solar projects, soiling data from on-site soiling stations may be available. Soiling may also be inferred from the generation of operating assets.
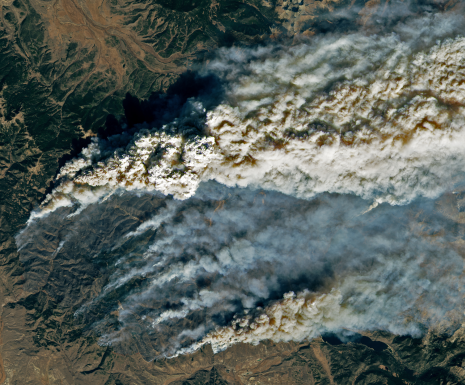
While precise, measured data is an important reference for understanding soiling losses, the long history available with modeled data makes it possible to put recent measurements in a historical context. For example, was the project site impacted by a regional soiling event such as a large wildfire or dust storm recently? Or was the soiling a site-specific phenomenon? Knowing the difference between a one-off event and a soiling-prone site means that stakeholders can more-effectively plan for and mitigate the issue.
Get started with SolarAnywhere
SolarAnywhere customers now have on-demand access to specific, data-driven intelligence such as soiling and snow loss estimates via the SolarAnywhere® API. With soiling loss data, solar owners and operators can reduce uncertainty in PV production estimates and accurately diagnose real-word issues causing PV underperformance. To learn more about SolarAnywhere’s trusted data and intelligence services, please contact us.
References
1 Particulate matter 10 micrometers or less and 2.5 micrometers or less, respectively.
2 L. Micheli, G. P. Smestad, J. G. Bessa, M. Muller, E. F. Fernandez, F. Almonacid, (2021): Tracking Soiling Losses: Assessment, Uncertainty, and Challenges in Mapping. IEEE Journal of Photovoltaics, Volume 12, Issue 1, p. 114-118. DOI: 10.1109/JPHOTOV.2021.3113858. Link
3 M. Coello, L Boyle, (2019): Simple Model for Predicting Time Series Soiling of Photovoltaic Panels. IEEE Journal of Photovoltaics, Volume 9, Issue 5, p. 1382-1387. DOI: 10.1109/JPHOTOV.2019.2919628. Link
Learn More!
Watch the on-demand webinar: Quantifying Impacts and Risks of Wildfires and Extreme Weather with Improved Performance Benchmarking


