SolarAnywhere customers have plenty to be excited about with this year’s release of Historical Data Version 4.0 (V4.0). Alongside substantial model enhancements that have reduced global data uncertainty, we’ve introduced a new data portal UX/UI with Map Overlay visualizations, making it easier to download data in bulk and understand solar extreme weather trends.
Consistent with years past, our annual validation whitepaper characterizes the accuracy of SolarAnywhere data across different regions. V4.0 validation includes measurements against 133 ground stations with 1198 years of reference data from spectrally flat Class A pyranometers. It also provides deeper insights into model performance by climate type, geography, seasonality and varying levels of cloud cover.
New feature highlights
Global improvements to irradiance model
Historical Data Model Version 4.0 (V4.0) has been significantly enhanced relative to its predecessors. V4.0 boasts global improvements, with the most notable changes made in Europe. Uncertainty reductions were accomplished through several updates to the irradiance model, including:
- The addition of dynamic water vapor
- Regional re-calibration of upper albedo bound (UAB)
- The application of an advanced technique to correct geospatial image misalignment (i.e., Jitter) in Europe
- The use of NASA CERES data from polar-orbiting satellites to supplement the irradiance model
These improvements help reduce bias and uncertainty globally. Additionally, Typical Year datasets in V4.0 extends data coverage from 2023 through 2024.
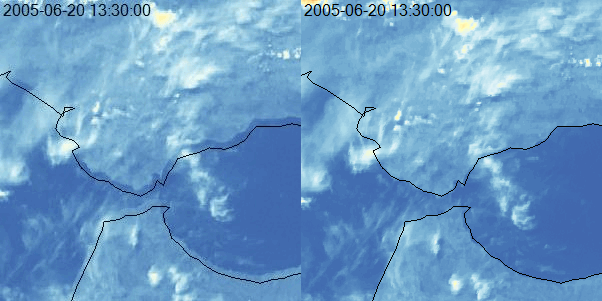
Key V4.0 improvements in Europe are illustrated in Figure 1, below. The figure displays native satellite imagery over the Strait of Gibraltar before and after correcting jitter from the EUMETSAT-operated MSG geospatial satellite. The result showcases our advanced technique to correct the relative translative offset between images.
Comparing the two images in this figure, it is evident that the second satellite image aligns more closely with the underlying geography, as represented by the coastline. By using spatially corrected satellite images in V4.0, jitter is resolved, reducing solar resource bias and uncertainty.
Figure 1: Native satellite imagery corrected for geospatial misalignment
New data portal UX/UI
Over the past year, the SolarAnywhere team has addressed key design and user experience pain points in our data portal. We collected and prioritized feedback from our users, revealing a strong desire for faster data access to more datasets simultaneously. As a result, we created a new Data Portal with a streamlined download experience, intuitive dataset organization, improved map functionality, and simplified licensing and purchase information. These improvements optimize usability while keeping in mind future scalability.
In the new data portal, all project locations are saved and accessible on the same map, regardless of license type. Users can download datasets across multiple locations simultaneously, with weather and irradiance data fields clearly grouped for easy navigation. The map now uses Google Maps for up-to-date satellite imagery and an enhanced map user experience. License types and data access are easy to compare and understand.
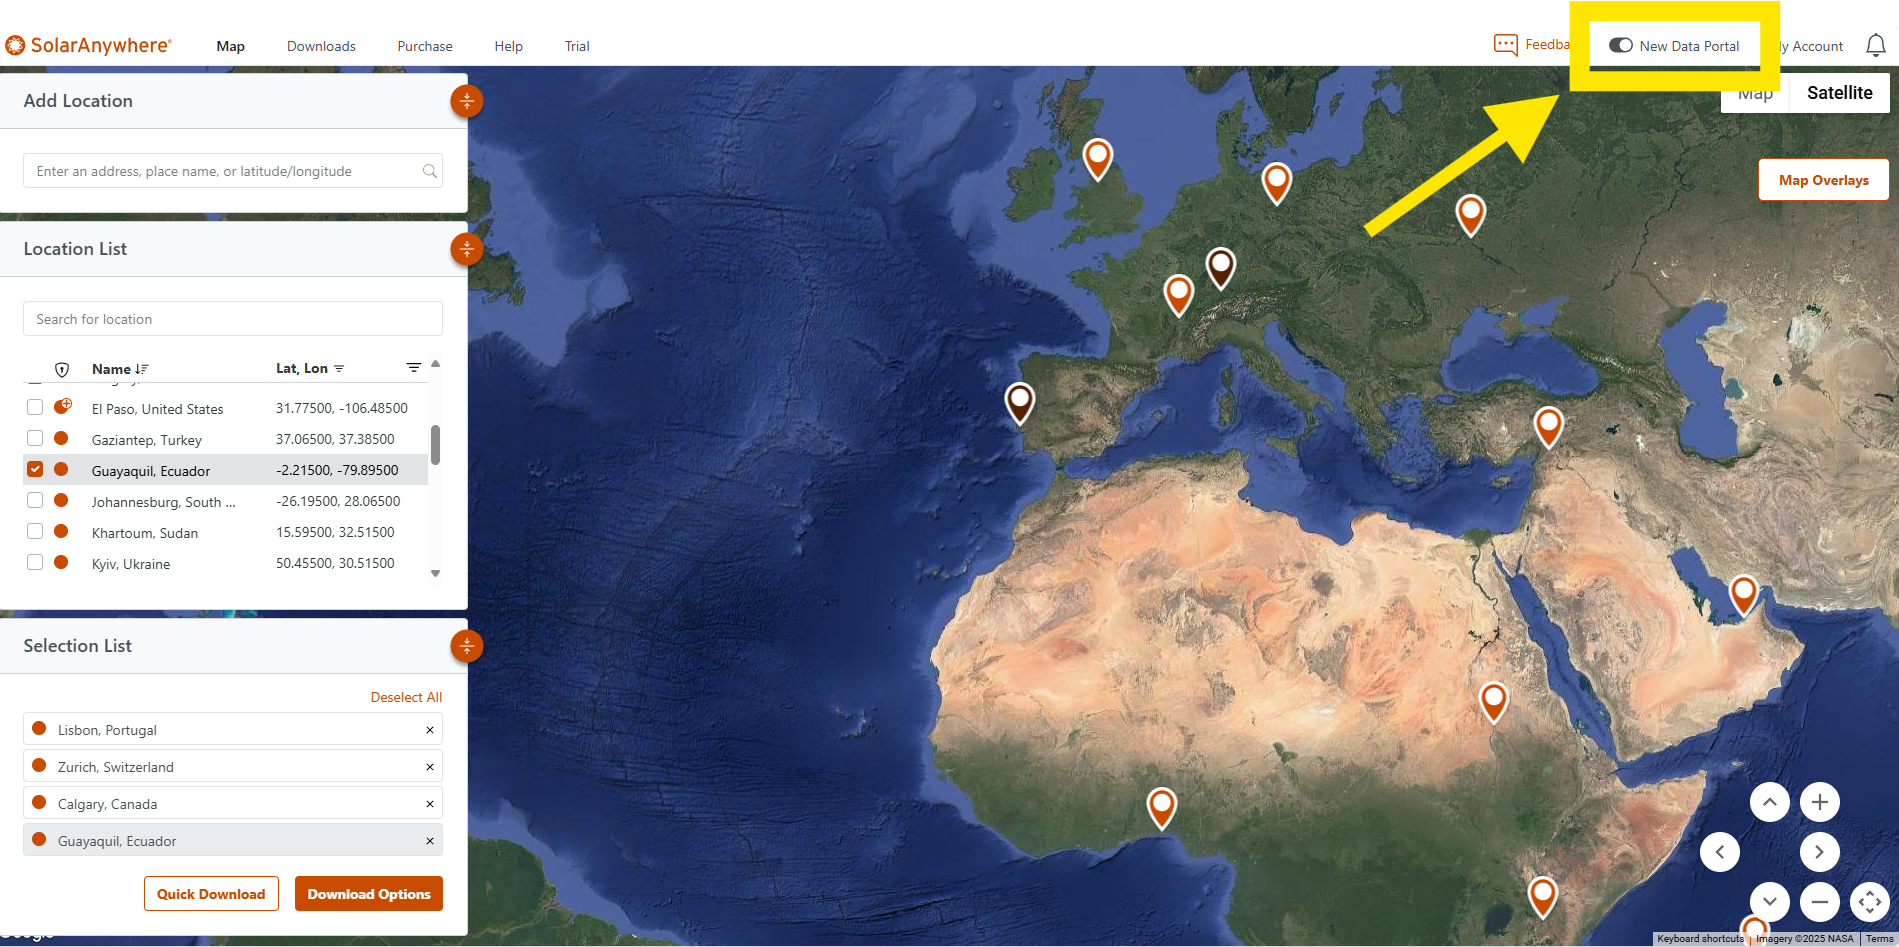
The new portal is available to all customers and can be activated via a toggle button at the top right of all data.solaranywhere.com pages.
All users are welcome to try the new interface by togging it on and providing feedback!
Figure 2: Toggle to access new data portal UX/UI
Improved V4.0 model validation
Solar resource uncertainty plays an important role in project financing and overall return. SolarAnywhere irradiance data (GHI, DNI) is validated against a robust network of ground sites to determine geographic uncertainty metrics such as MBE, MAE and RMSE.
The SolarAnywhere V4.0 validation whitepaper includes an expanded network of ground stations to validate the model’s performance under various weather conditions, such as sunny, cloudy and dark days.
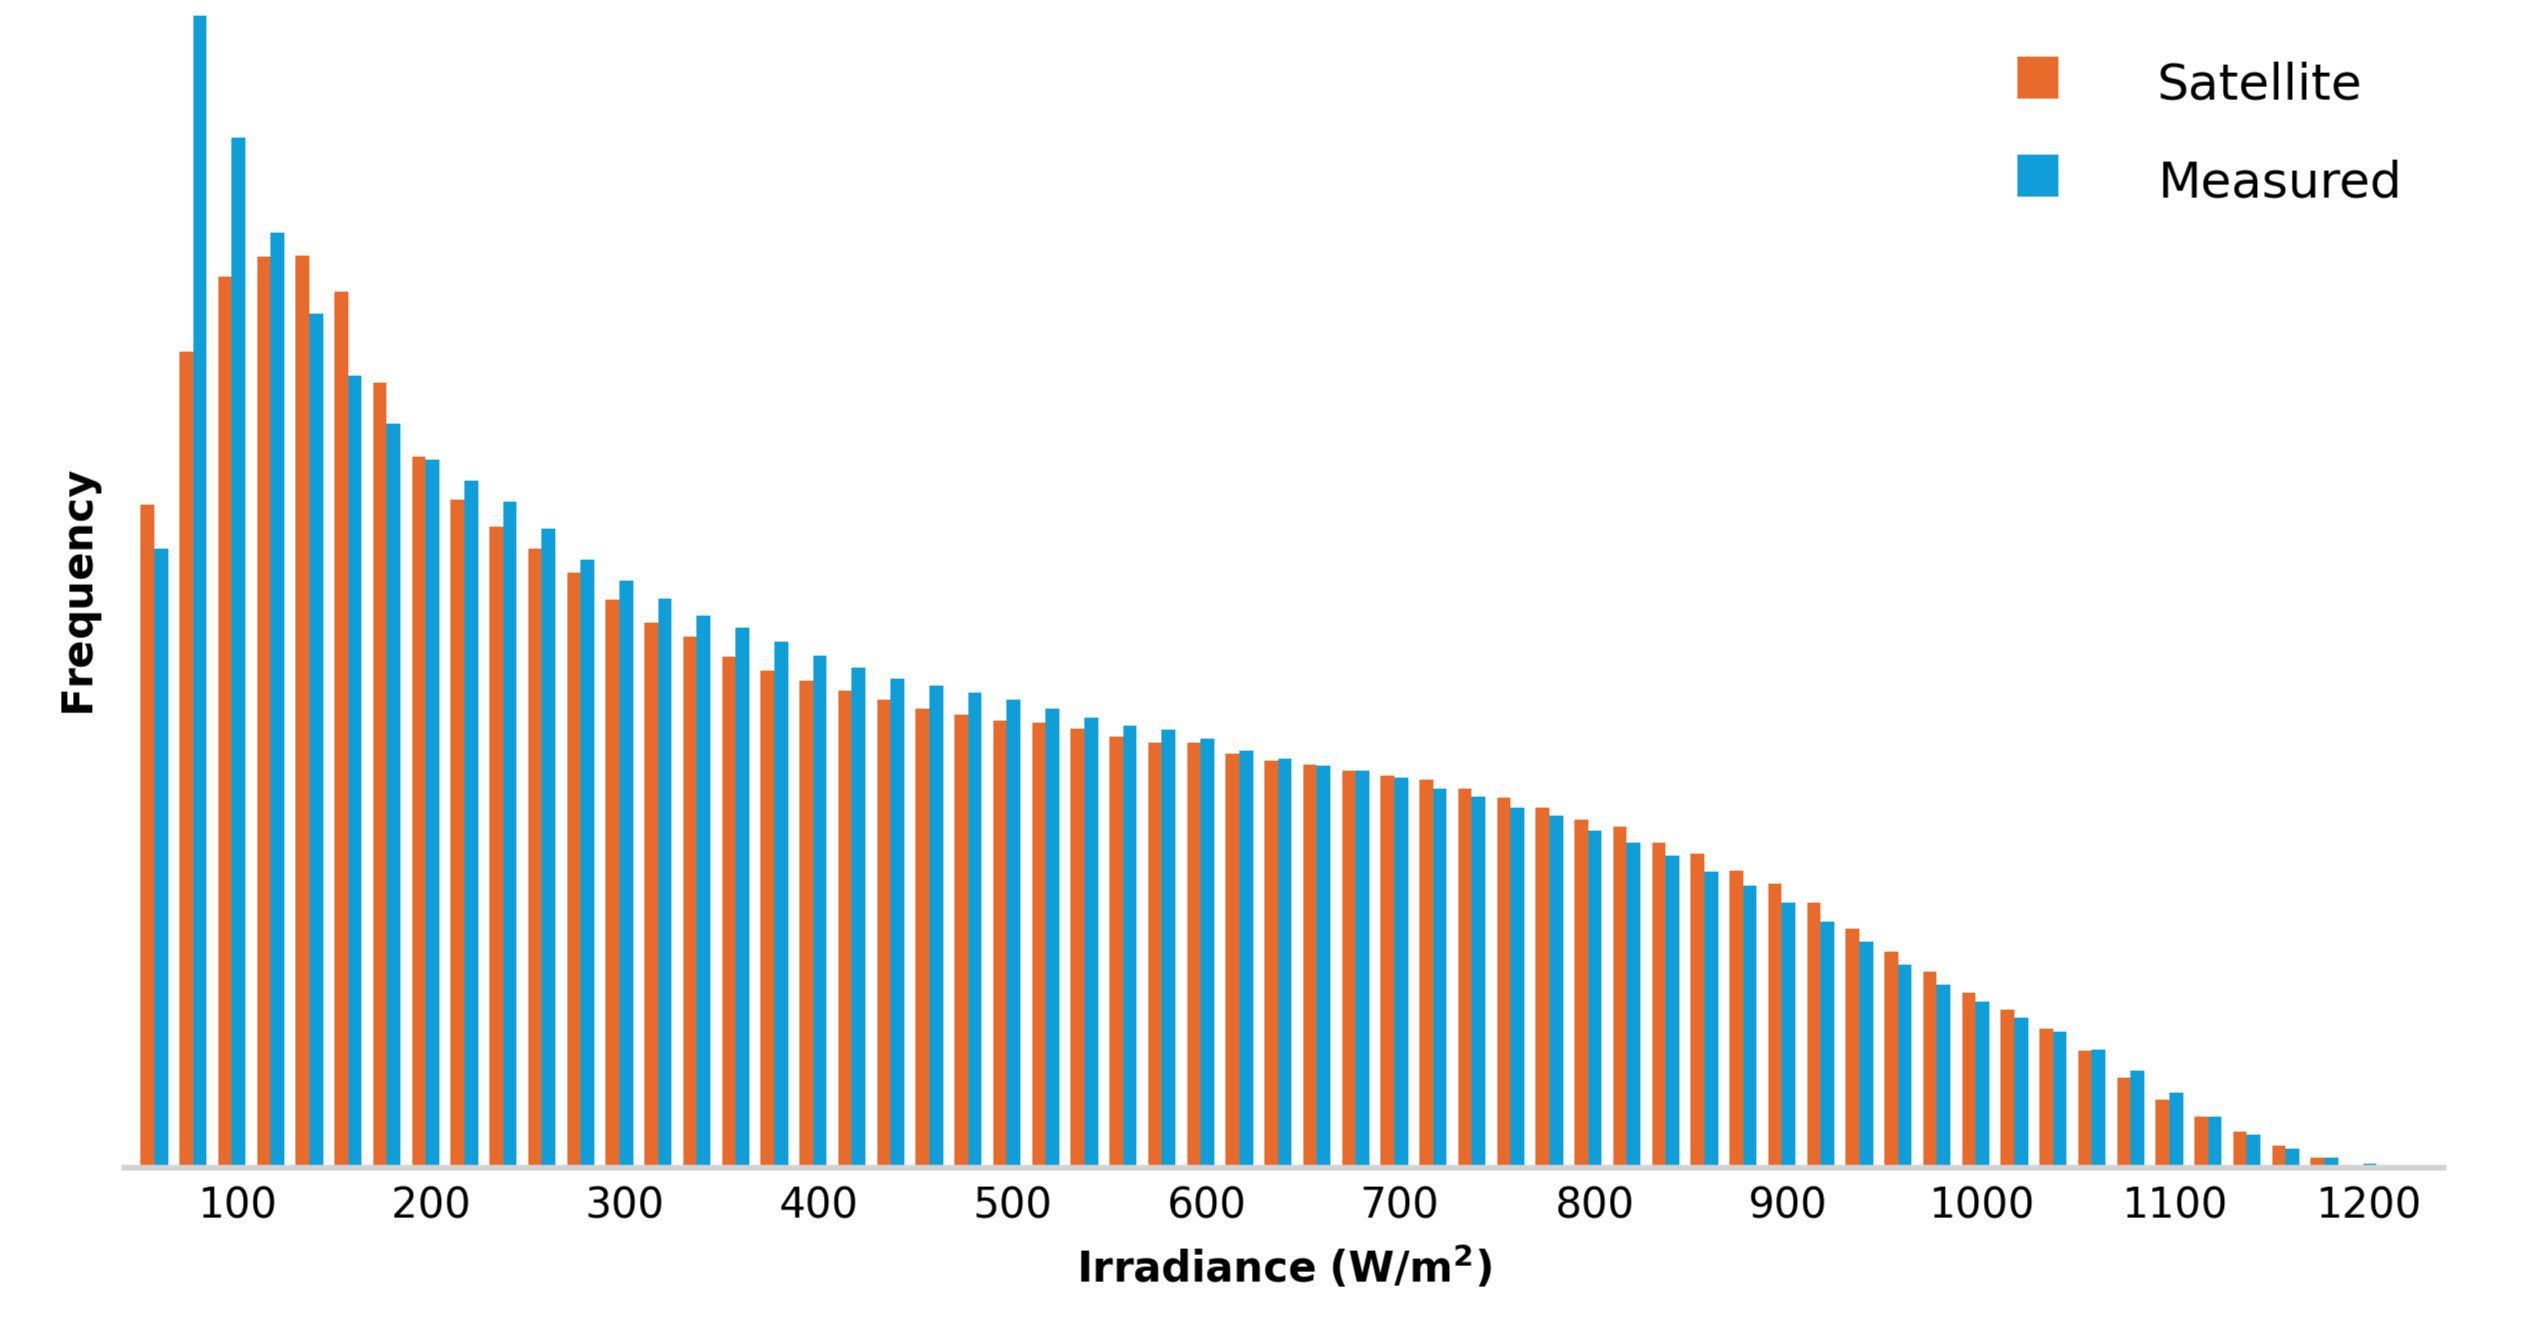
Figure 3 illustrates how the V4.0 irradiance model performs across various amounts of cloud cover.
Figure 3: Global model accuracy by irradiance threshold
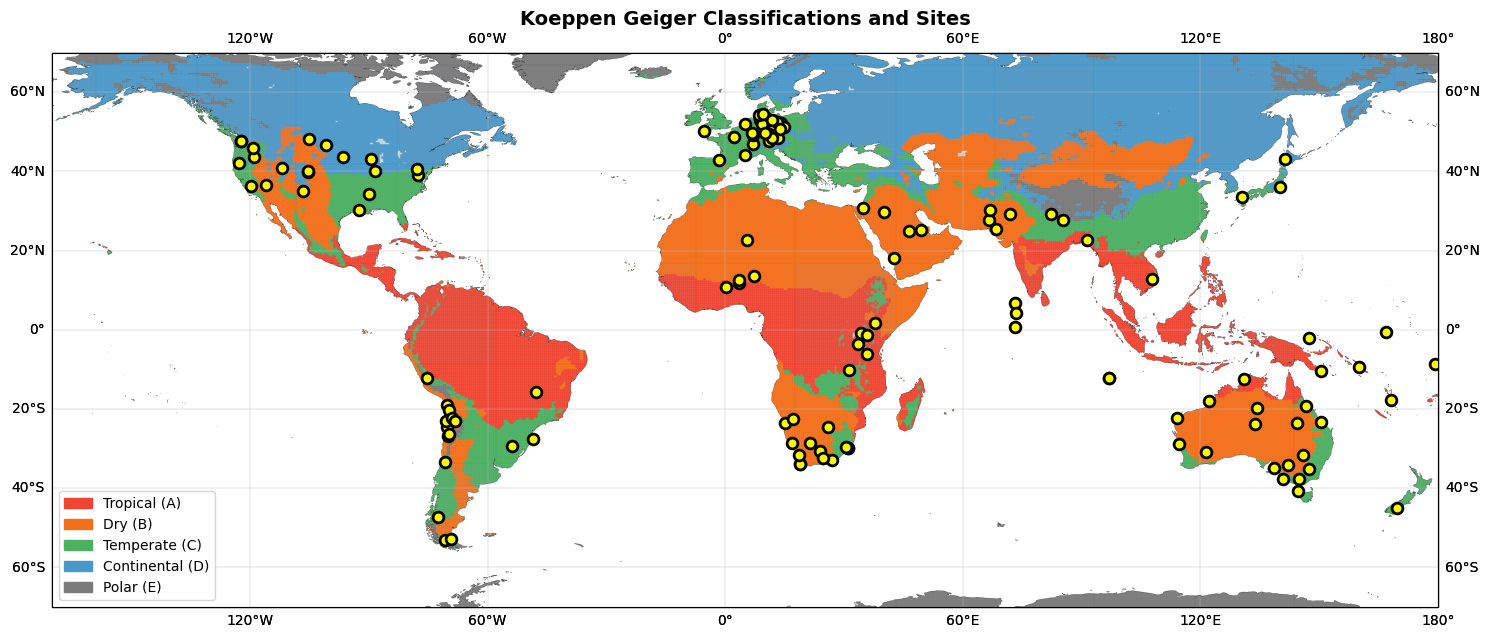
The SolarAnywhere validation paper also offers a more detailed analysis of uncertainty by climate type via Koppen-Geiger classifications, giving professionals an additional perspective on the quality of SolarAnywhere data. We offer the utmost transparency about where the SolarAnywhere model performs best, and where uncertainty may be greater.
Figure 4 illustrates the diversity of climates within each geography.
Figure 4: Koppen-Geiger classifications and SolarAnywhere validation sites
Solar resource and extreme weather Map Overlays
When prospecting for PV project locations, it’s crucial to have efficient tools to quickly understand irradiance and weather trends across large areas. SolarAnywhere Map Overlays address this need by offering comprehensive visualization of global data for irradiance, temperature, wind gusts, snow depth and precipitation.
As instances of extreme weather become more common, these high-level visualization tools are more important than ever. SolarAnywhere Map Overlays can serve as a starting point to visualize potential risks and understand solar resource and weather trends. For example, considering maximum wind gust values derived from a coarse resolution numerical weather prediction model can help reveal potential risks to a PV asset depending on location. This can signal to stakeholders whether a more detailed analysis of wind stow at that location is warranted, using historically modeled time-series data or a ground-measured wind dataset to more accurately capture variability and site-specific risk.
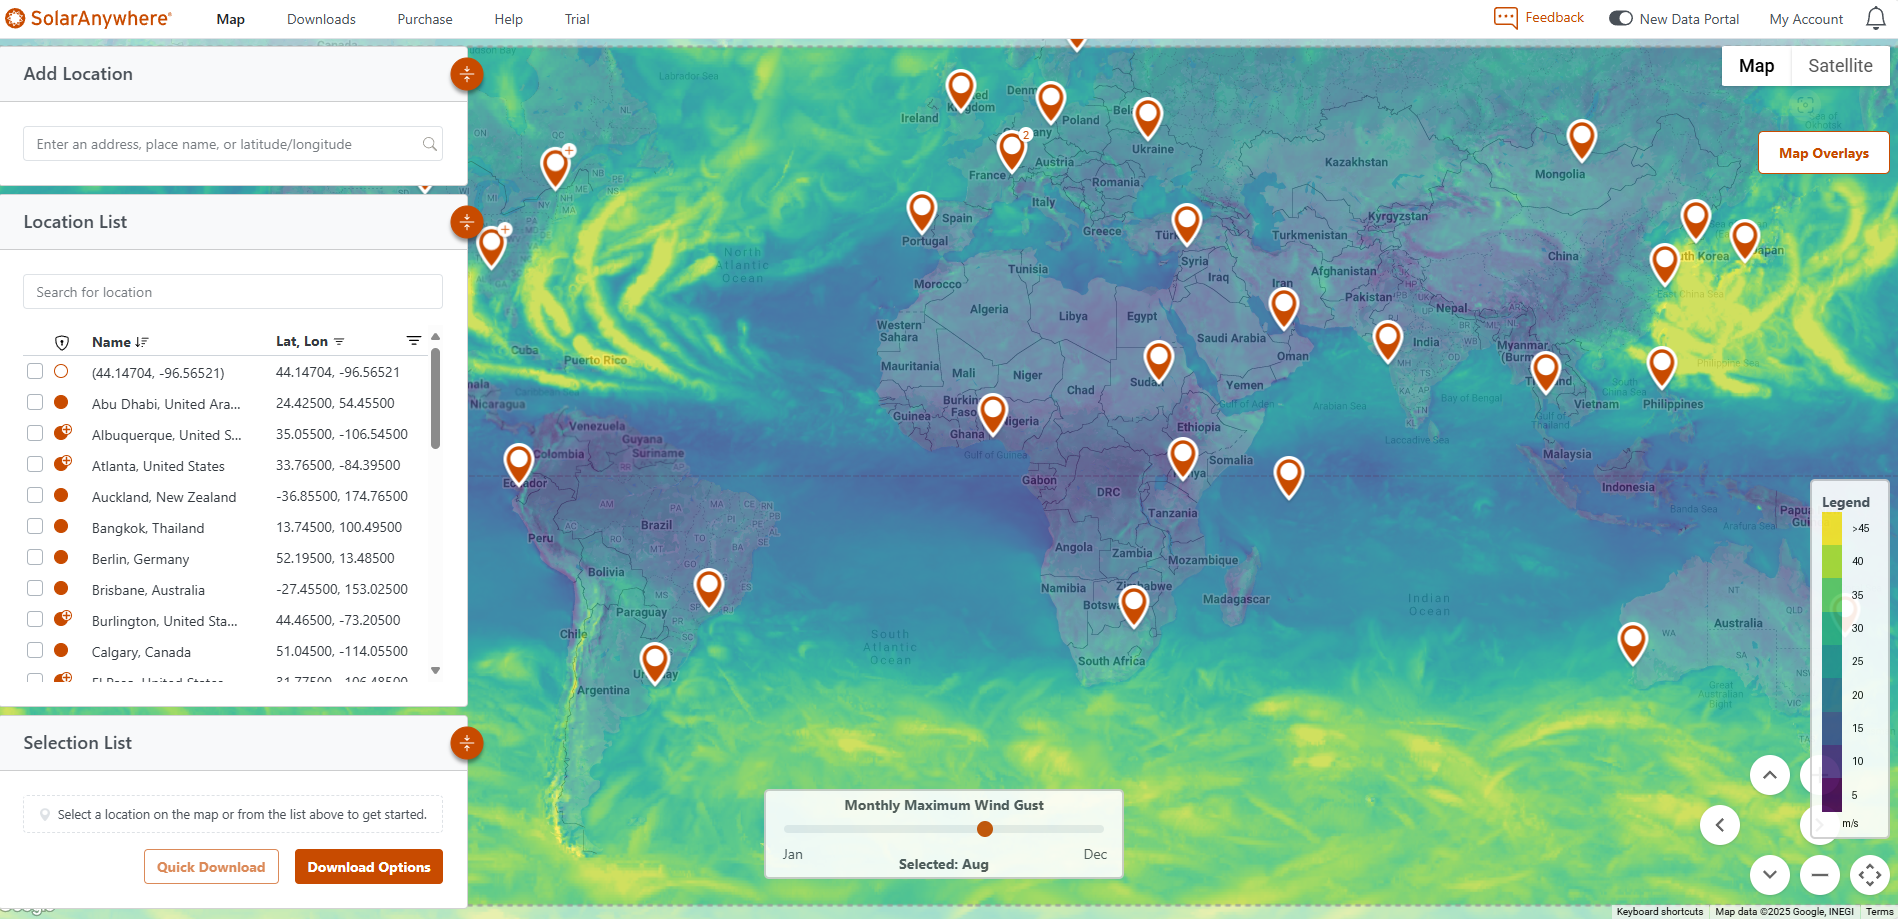
Figure 5 displays the ‘Monthly Maximum Wind Gust’ Map Overlay available in the new data portal. Users can easily toggle between average months using the monthly slider at the bottom of the webpage to visualize global wind gust trends.
Figure 5: Maximum monthly wind gust Map Overlay
Upon logging into the new data portal, users can enable any of the Map Overlays1 shown in Figure 6. Once selected, these overlays will appear over the map view. Users will retain all map functionality, including selecting location pins and downloading data, regardless of whether a Map Overlay is applied.
Figure 6: Map Overlay descriptions
1All Map Overlay data generated from ERA5 at a 25km spatial resolution
Future research
The teams at Clean Power Research are developing additional extreme weather and climate change datasets for risk-characterization for the solar industry. For example, we are researching methods to quantify impact from wildfire smoke on irradiance and advanced downscaling techniques to enhance coarse resolution climate projections.
If you would like to learn more about our research or become a technical partner, please contact us.
Get started today
Log in to the data portal to explore the new UX/UI and Map Overlays. For detailed information on model improvements and reduced global data uncertainty, read the validation whitepaper. If you don’t already have a SolarAnywhere account, sign up for free to access all features at select locations at no cost. Feedback is always appreciated—please don’t hesitate to provide feedback directly via the data portal or contact our team directly!
