Clean Power Research® releases a new SolarAnywhere® data version annually. This year’s update addresses the changing needs of the solar industry as projects expand to more northern, snowy locations with appreciable wind risk by offering new high-latitude irradiance data.
Consistent with years past, we also published our annual validation whitepaper to communicate the accuracy of our data across different regions. Validation of Data Version 3.8 (V3.8) includes deeper insights into model performance by climate type in addition to geography.
High latitude irradiance data
Why is high latitude data important?
As large-scale solar development extends to traditionally unconventional areas, the need for quality solar resource data follows. This is especially true in high latitude areas that experience strong variation in day-lengths depending on the season of the year—such as Alaska1 and the Nordics2.
Figure 1 illustrates the expanding development of solar plants with greater than 20 MW capacity in high latitudes within the United States. This trend is likely to continue due to lower solar energy costs3 and advances in technology and modeling4.
Beyond the United States, large-scale PV systems are also becoming more prevalent. In Nordic countries and other high latitude regions, several factors contribute to PV adoption:
- Energy Security5 – Countries with limited fossil fuel resources and/or complex geopolitical situations prioritize renewable energy sources to enhance energy security.
- Climate Goals6 – Many nations within high latitude regions outside the U.S. have ambitious climate targets, driving investment in clean energy solutions.
- Incentives and Policies7 – Favorable policies, subsidies and feed-in tariffs encourage PV deployment.
- Technological Advances8 – Advances in PV efficiency and grid integration make solar power increasingly viable worldwide.
Overall, high latitude irradiance data is important to inform development strategies at extreme latitudes that enable continued global adoption of PV.
Figure 1: U.S. Utility-Scale PV Plants Extend to High Latitudes
Data sourced from the USGS/LBNL Large-Scale Photovoltaic Database (USPVDB)9 and U.S. Energy Information Administration Form EIA-86010 data
SolarAnywhere high latitude irradiance data offerings
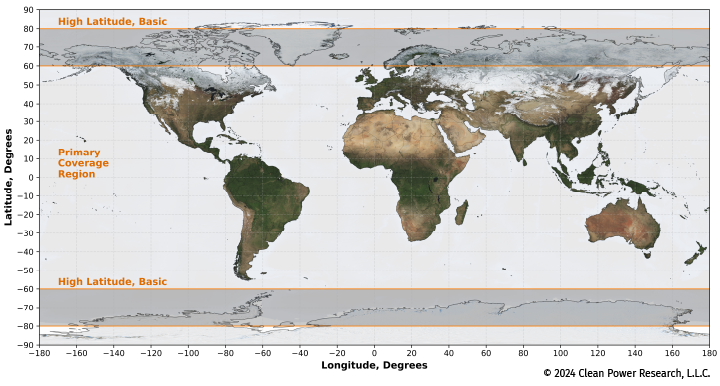
Starting in V3.8, SolarAnywhere provides basic high latitude irradiance and weather data from +/-60 to +/-80 degrees in the form of Typical Meteorological Year (TMY) and Average Year Summary (AYS) datasets, suitable for preliminary solar prospecting and design.
Like data in our primary coverage regions, we provide metrics on uncertainty validated against a network of ground stations11 so users have confidence in data quality and uncertainty.

Wind data
SolarAnywhere V3.8 also includes wind data important for PV system modeling and for project risk-assessment. These fields are available in both our web-based data portal and API for all historical license types. These new fields will better inform project developers and engineers of physical risks due to extreme weather.
Many tracking systems now include the capability to specify stow-angles in their design. In addition, various stowing strategies12 with independent row control are under consideration by owners and operators to limit damage during large storms13. Stowing strategies can include max wind gust triggers for initiating stow, shielding interior rows with exterior rows, optimization of stow angles and defining safe conditions for exiting stow.
Uncertainty by climate type
Solar resource uncertainty plays an important role in project financing and overall return. SolarAnywhere irradiance data (GHI, DNI) are validated against a robust network of ground sites to determine geographic uncertainty metrics such as MBE, MAE and RMSE.
V3.8 includes more comprehensive analysis of uncertainty by climate type, in addition to satellite coverage region, to give professionals an additional perspective on the quality of our data. We offer utmost transparency about where our model performs best, and where uncertainty may be larger.
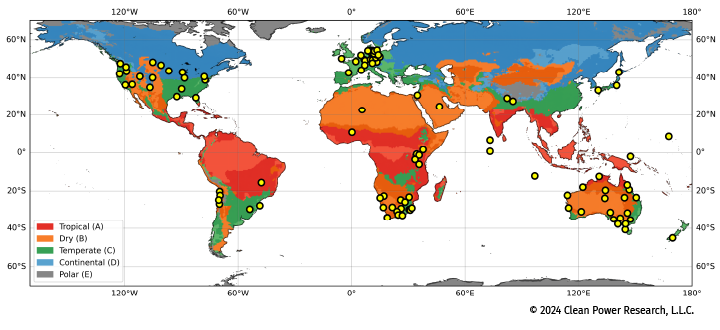
Temporal uncertainty metrics are provided as long-term, annual, monthly and daily averages. Climate type uncertainty metrics are categorized by Koppen-Geiger Climate classifications15. Figure 4 below illustrates the diversity of climates within each geography.
Figure 4: Koppen-Geiger Classifications and SolarAnywhere Validation Sites

Research into snow detection
As part of our continuous effort to improve the SolarAnywhere model, we also conducted research into snow detection methods and validation frameworks. These include machine-learning based detection of snow from satellite imagery, which has a direct effect on albedo used in PV power simulations. While V3.8 does not include these updates yet, we plan to finalize our research in future releases.
Explore our datasets
The new features in SolarAnywhere V3.8 are a product of the innovations at Clean Power Research. Watch the video below for more information, or contact our team to inquire about feature specifics, schedule a demo or explore our other solar industry products.
References
1 Whitney, E. (2021, October 5). Snow losses in photovoltaic systems. IEA Photovoltaic Power Systems Programme. Link
2 Swedish Energy Agency. (2022). National Survey Report of PV Power Applications in Sweden. IEA Photovoltaic Power Systems Programme. Link
3 Energy.gov. (n.d.). SunShot 2030. Link
4 Zewe, A. (2023, August 17). Improving Solar: Looking Beyond Hardware. Massachusetts Institute of Technology. Link
5 Nordic Energy Research. (2023, October 11). Integrated Nordic Energy Systems Will Increase Energy Security and Self-Sufficiency. Link
6 Nordic Energy Research. (2022). Nordic Energy Research Strategy 2022-24. Link
7 European Parliament, Council of the European Union. (2023, October 18). Directive EU/2023/2413. Link
8 PV Magazine. (2023, December 12). Empowering the Energy Transition: New IEA PVPS Task 19 Sets the Stage for Global PV Grid Integration Collaboration. Link
9 EERSCMAP. (n.d.). U.S. Solar Photovoltaic System Database. Link
10 U.S. Energy Information Administration. (n.d.). Form EIA-860 data. Link
11 BSRN. (n.d.). BSRN Stations. Pangaea.
12 Array Technologies, Inc. (n.d.). The Challenge of High Winds at Utility-Scale Solar Sites. Link
13 Weaver, J. (2021, November 8). Storm damages shine spotlight on ways to mitigate impact of wind on PV arrays. PV Magazine. Link
14 Faheid, D., Afshar, P., Kaiser, C., Sutton, J., Gilbert, M., Ward, T. (2024, May 17). At least 7 dead after hurricane-force winds pound Houston as power outages persist amid rising temperatures. CNN. Link
15 National Oceanic and Atmospheric Administration. (2024). Köppen-Geiger climate changes 1901-2100. Science On a Sphere. Link
