In our last blog, we talked about the performance of SolarAnywhere® v4 PV fleet forecasts, and discussed how accuracy was a function of the PV fleet’s geographic footprint. For instance, SolarAnywhere hour-ahead forecasts in the Western U.S. were shown to have a capacity-normalized mean absolute error (MAE) of 3.5% for a single power plant. However, the MAE of SolarAnywhere forecasts for a fleet distributed over an area the size of New York State was reduced to nearly 1%. At 24 hours-ahead, MAEs were respectively 4.5% and 2% for the single point and the extended area fleet.
In this blog, we’re focusing our discussion on the cost of missed forecasts, and by inference, on the logistics of delivering the equivalent of 100% accurate forecasts.
The MAE and other accuracy metrics such as the Root Mean Square Error or the hit/miss ratio are good indicators of a forecast model’s performance. However, these indicators are statistical measures that imply a non-zero probability that some forecasts will be missed.
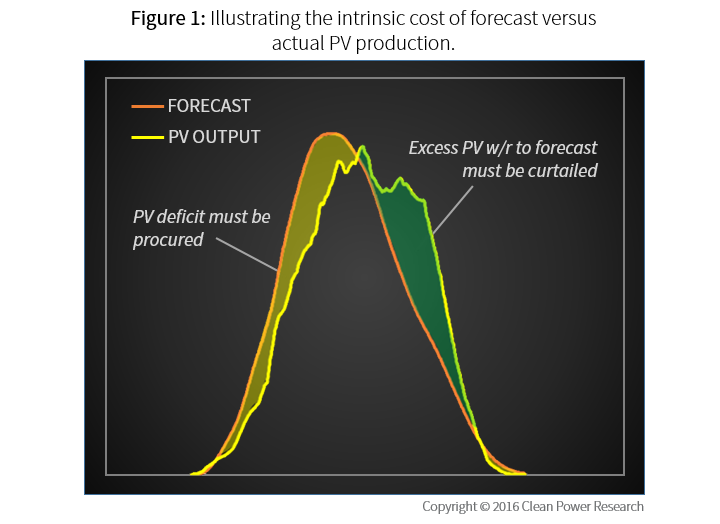
What is the cost of these missed forecasts? The going rate depends on the rules and regulations in effect in a particular energy market. These rules are intended to account for the costs of increased reserves and grid flexibility necessary to manage solar photovoltaic (PV) output uncertainty. Fundamentally, however, the cost of missed forecasts is traceable to two underpinnings:
- Procuring the missing energy in the case of forecast overestimation.
- Wasting excess energy in the form of curtailment, or absorbing/backing-up excess energy in the case of forecast underestimation. This is illustrated in Figure 1.
In a recent research paper, Perez et al., calculated this fundamental underlying cost from first principles. They calculated the amount of PV curtailment and backup necessary to make up for any PV fleet forecast excess/deficit over one year in two climatic regions of the United States: the semi-arid West, and the humid continental East. This analysis was conducted for both hour-ahead and day ahead forecasts.
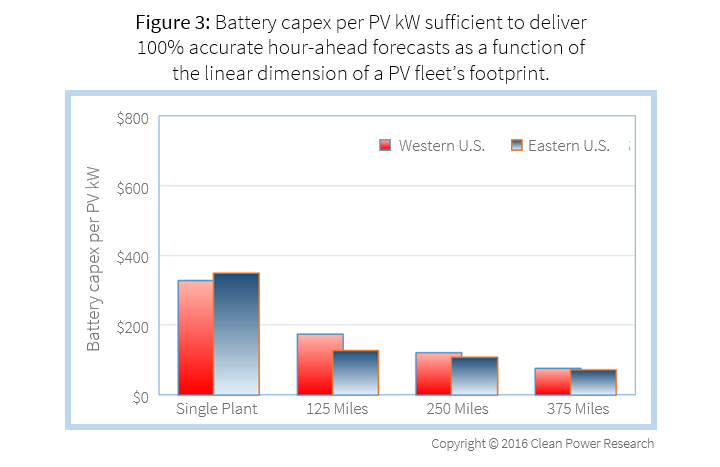
One way to conservatively estimate the cost of PV curtailment/backup due to missed forecasts is to calculate the cost of the storage hardware needed to absorb/backup the worst-case forecast deficit/excess. A nominal battery cost of $300 per kWh of storage capacity was assumed, which corresponds to the costs announced by leading manufacturers of battery storage systems.
The analysis assumed that batteries are operated to:
- Absorb excess generation when the actual fleet output exceeds forecasted output.
- Complement generation when the PV fleet output is less than forecasted, with allowance for off-peak [nighttime] recharge if needed.
PV fleets ranging from a single plant to a regional balancing area the size of Texas were investigated.
Figures 2 and 3 illustrate the results for hour-ahead forecasts. Figure 2 reports the amount of PV energy that must be curtailed (and backed-up) as a function of the fleet’s footprint. Four footprints are illustrated in the figure, corresponding respectively to a single plant, and dispersed fleet areas the size of Massachusetts (125 miles), New York State (250 miles) and California (375 miles). Curtailed energy is reported as a percentage of the total fleet’s production.
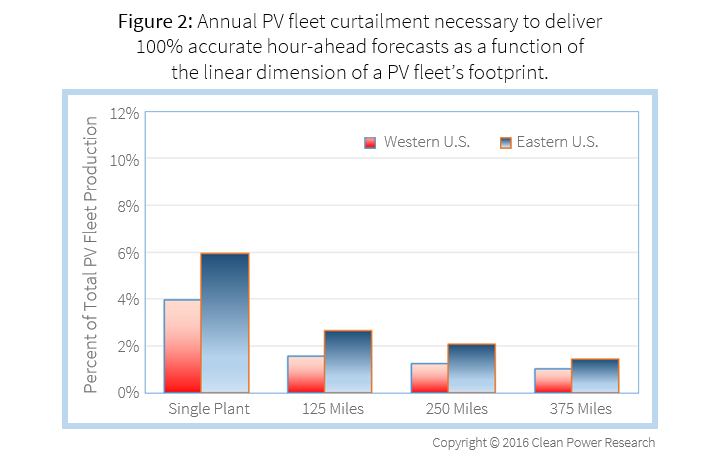
Figure 3 reports the cost of the battery system that can deliver 100% accurate forecasts if operated in parallel with a PV fleet to absorb excesses and supply deficits. Battery cost is normalized to one nominal PV kW.
Figures 4 and 5 are equivalent to Figures 2 and 3, but for day-ahead forecasts where curtailment and battery sizes are calculated to ensure that hour-to-hour, day-ahead predictions are guaranteed.
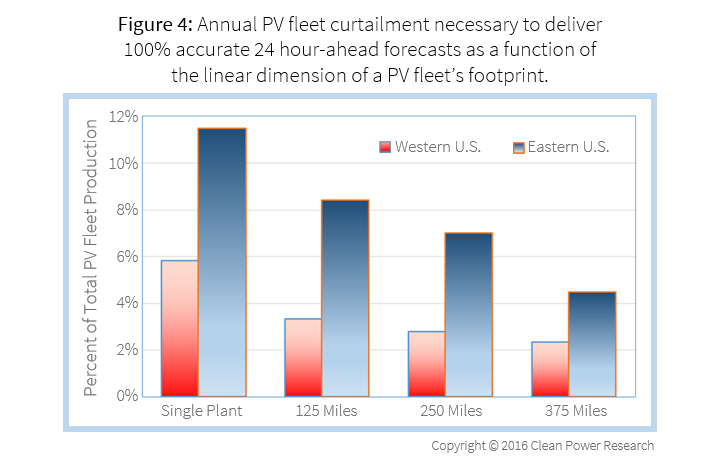
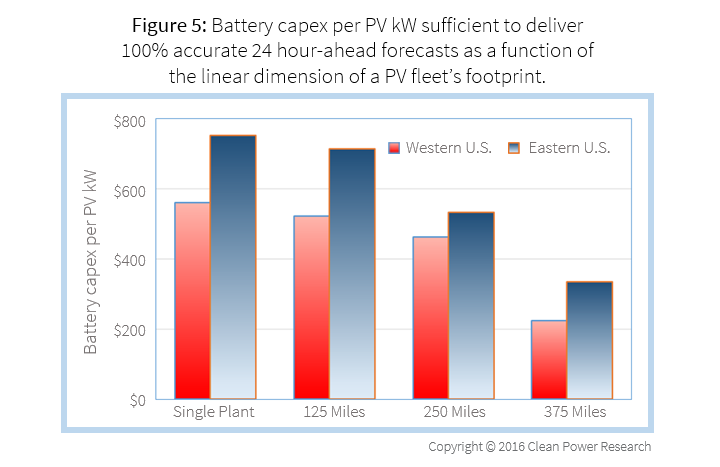
These results show that, as forecast accuracy improves as the fleet’s footprint increases in size (see our last blog), the logistical cost of delivering 100% accurate forecasts decreases. Indeed, forecast guaranties can be achieved at a reasonably low cost for independent system operator (ISO) balancing areas.
For instance, if electrical storage batteries are used as a means to deliver guaranties, the cost for a California-size ISO area would represent 2-3% of the PV fleet’s capital expenditure (capex) for hour-ahead guaranties, and 10-15% for day-ahead guaranties. If curtailment and backup are applied by other means than battery storage, the energy curtailed/backed-up would amount to approximately 10% of a PV plant’s production for single-point, day-ahead guaranties, and as little as 2-3% for large balancing areas. Hour-ahead guaranties could be achieved with 1-2% curtailment/backup.
The cost of these operational guaranties depends on the performance of the forecast model. The results presented here are achieved with SolarAnywhere v4 PV fleet forecasts, a state-of-the-art model that is operational at high resolution throughout North America. In a following article, we’ll provide a comparison of SolarAnywhere® v4 versus other forecast models, and quantify the differences in the operational cost of providing forecast guaranties.
Take away
When applying an efficacious PV fleet forecast model such as SolarAnywhere v4, delivering the operational equivalent of 100% prediction accuracy is a relatively low cost option that could be available to grid operators in the US. The operational certainty could be achieved, for example, by operating dispersed battery hardware in coincidence with the dispersed PV fleet output.
The cost depends on the regional climate (better in the West), and on the fleet’s footprint (better larger). In any case, this cost would remain very low compared to the cost of PV. With a good operational forecast, ISOs in the U.S. can count on perfect forecasts at a cost amounting to a few percent of a PV fleet’s capex.
You can read more about this topic in the paper “Solar Energy Forecast Validation for Extended Areas & Economic Impact of Forecast Accuracy.”
