In a recent NREL report, interviews of 13 operating entities in the Western Interconnection found that “Variable generation (VG) forecasting is widely considered to be a key means of integrating wind and solar power efficiently and reliably as these resources become increasingly common.”

This includes forecasting not only utility-scale wind and solar plants, but also distributed ‘behind-the-meter’ generation. In fact, half of the operating entities interviewed said that forecasting behind-the-meter generation is an “imminent need,” although the NREL report acknowledges it is an emerging technology. “If solar forecasting is in its infancy, distributed solar forecasting is at an even more rudimentary stage. Operating entities are puzzling through what data they can access and how they can use them.”
Distributed solar forecasting is growing up
Accurately forecasting behind-the-meter PV fleet production presents unique challenges, as the production of any given photovoltaic (PV) system at any given time is subject to a variety of variables—from the available solar resource and the unique characteristics of each PV system, to requirements for frequent, accurate forecasts to meet the time horizons required for load balancing and reserve dispatch operations.
The California Solar Initiative (CSI) has been a champion of solar forecasting, and as a result of recent Research, Development, Demonstration and Deployment (RD&D) awards, forecasting technologies are rapidly advancing. Recipients of two CSI RD&D awards and a companion CEC PIER project, we at Clean Power Research have developed and tested new technologies for forecasting behind-the-meter PV. These projects have enabled us to develop capabilities integral to forecast generation, including a state-of-the-art solar resource database for the entire state of California, fleet simulation methodologies, and a massively parallel architecture using cloud computing to perform rapid simulations.
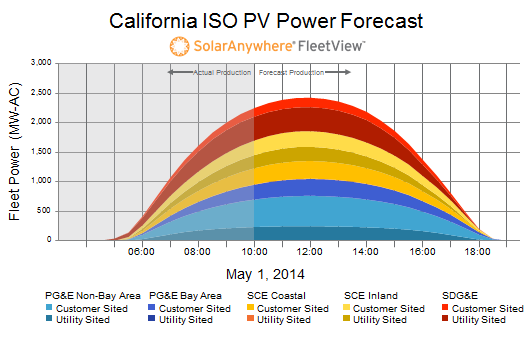
As a result of the most recent project, the California Independent System Operator (ISO) is today receiving a forecast every thirty minutes of most of the distributed PV systems within its service territory. Each forecast results from a series of computations:
- Create a solar forecast using high resolution satellite data, cloud motion vector approaches, and numerical weather prediction models.
- Correlate location-specific solar resource time-series data with each system included in the forecast. Today this is about 185,000 PV systems, but the number continues to grow.
- Simulate PV power production for each individual system.
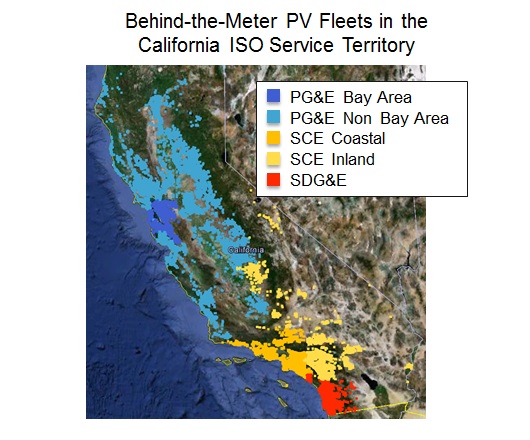
- Aggregate the results according to five, California ISO-defined regions.
- Deliver forecasts to the California ISO.

These projects have demonstrated not only that high resolution solar resource data can be accurately produced, but that it can be combined with PV system specifications to accurately simulate PV fleet production. Additionally, we have shown that by using the appropriate computing resources and underlying system architecture, the simulation process can be performed quickly enough—even when forecasting production of hundreds of thousands of systems—to meet the requirements of real-world ISO load balancing applications.
The case for starting early
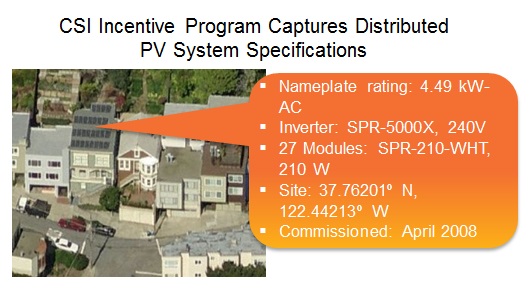
Respondents to NREL’s research on improving VG forecasting in the West advised “start sooner rather than later, as it can take time to plan, prepare and train a forecast.” This is sage advice. Forecast accuracy depends on the accuracy of its inputs. One key input is detailed PV system specifications, including PV manufacturer and model, number of panels, inverter manufacturer and model, number of inverters, system azimuth, system tilt, and other data.

The California ISO forecast is possible today because of the CSI’s early focus on efficient incentive administration. Our PowerClerk® program has supported the administration of the CSI program since its inception. While processing incentives through PowerClerk, California simultaneously developed a comprehensive database that includes information on all PV systems that have received incentives under the CSI program.
The California ISO forecast includes ‘most’ of the distributed PV systems in its territory, but not all. As California realizes the original CSI vision of an incentive-less world where consumers are installing PV systems without CSI incentives—and this many years earlier than the original 2016 deadline—detailed system specifications are no longer captured in a unified way for the state of California.
Capturing system specifications for all behind-the-meter PV systems is more critical today than ever. We believe this can be accomplished most consistently through the interconnection process. As a result, we are taking the lessons learned over of the last decade processing approximately three-quarters of the distributed PV incentives in the U.S. to develop a web-based interconnection tool: PowerClerk® Interconnect™.
Supported by a DOE SunShot Incubator award, PowerClerk Interconnect brings the power of PowerClerk to interconnection processing. In addition to dramatically streamlining the interconnection process, PowerClerk Interconnect provides the critical component of detailed PV system specifications required for accurate behind-the-meter PV fleet forecasting.
Looking ahead
There is a clear path forward to forecasting behind-the-meter PV fleet production. As an industry, we need to continue to collect detailed PV system specifications, most likely through the interconnection process. As a company, we are continuing forecast model improvement to increase accuracy, and we are assisting in the integration of forecasts into software tools used by utilities and ISOs for load balancing and reserve dispatch operations. We are also working on expanding availability across the U.S. to help meet the “imminent need” for behind-the-meter PV fleet forecasting.
Resources
CSI RD&D Solicitation 3: Integrating PV into Utility Planning and Operation Tools
- Final project webinar
- Project website
CSI RD&D Solicitation 1: Advanced Modeling and Verification for High Penetration PV
- Final report
- Final project webinar
- Project website
