In Part 1 in our series on the solar value proposition, we looked at a new approach to valuing PV. With this new approach, there is a need to quantify deferred and avoided generation, as well as transmission and distribution capacity increases through peak-load reduction (PLR) and effective load-carrying capability (ELCC), respectively. Here in Part 2, we’ll map out in more detail the requirements and steps toward calculating these values.
Correctly calculating ELCC and PLR
Despite their straightforward origins, the ELCC and PLR can be challenging to calculate correctly. And given that the ELCC and PLR significantly impact the calculated value of distributed PV (as much as 25%), it’s not surprising that their values receive a great deal of attention.
In order to correctly calculate the ELCC and PLR, one must obtain time-synchronized PV production data—in other words, the energy produced from a particular PV system in regular intervals. Net metered data is not sufficient, as it does not represent gross PV production. However, even without measured gross PV production, one can correctly calculate ELCC and PLR from simulated PV production with:
- time-synchronized irradiance data; and
- PV system specifications within the existing (or forecasted future) PV fleet.
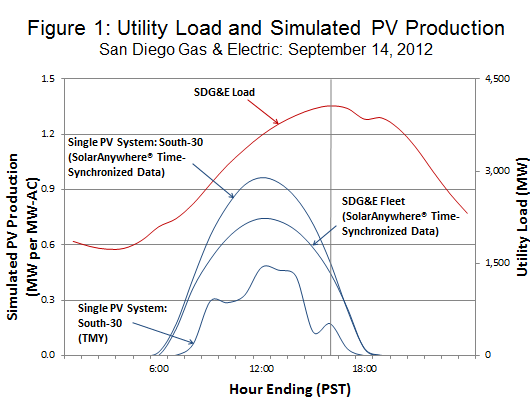
The dramatic difference that can exist between the use of time-synchronized irradiance data (e.g., SolarAnywhere® Data), and non-time-synchronized irradiance data (e.g., TMY data) is illustrated in Figure 1. This figure plots utility load and simulated PV production for San Diego Gas and Electric (SDG&E) on September 14th, 2012, for identical PV systems (south-facing, 30 degree tilt). Over the peak hours of the year, the differences in simulated PV production between time-synchronized and the non-time-synchronized simulated production resulted in a 30% difference in the calculated ELCC—56% versus 43%, respectively.
Using time-synchronized irradiance data alone, however, will not allow one to correctly calculate the ELCC and PLR. Figure 1 also illustrates that a large difference in PV production exists between a single PV system and the PV Fleet. Over the course of a year, these differences in simulated PV production result in a very meaningful difference in the calculated ELCC— 47% for the SDG&E Fleet versus 56% for a single system.

The need for PV fleet specifications
Given that very few PV systems, especially residential PV systems, have metered data for gross PV production, it becomes critically important to capture PV specification data to accurately simulate PV production. From these simulations, regionally representative values for PV’s ELCC and PLR can be calculated.
The system data needed for accurate PV production simulation include location, shading, orientation, tilt, type (fixed or tracking), module model and inverter model. Fortunately, this data has been captured by a number of solar incentive programs, including the California Solar Initiative, and other energy agencies and utilities using software tools such as PowerClerk®.
PowerClerk enables the requisite system specification data to be easily fed into advanced simulation software. Using these system specifications and time-synchronized irradiance data, the power output of tens or hundreds of thousands of individual PV systems can be calculated on an hourly or sub-hourly basis. Individual system power simulations are then aggregated into a fleet representation. Thus, today it is possible to accurately simulate PV fleet production in many high-penetration PV areas, and from it find PV’s ELCC and PLR, and ultimately its value proposition.
A more complete picture
Using the techniques and technologies described above, the road to a new and more detailed understanding of PV is beginning to develop—one in which the costs and benefits of PV are objectively valued and compared on an apples-to-apples basis with its new peers, the group of significant electricity generation resources.
