Our previous post discussed how to produce solar PV production profiles for fleets of PV systems. In it we highlighted the importance of including both system diversity (tilt, orientation, shading, etc.), and geographical diversity (system locations and relative proximity) when modeling PV power production.
High Frequency Solar Power Variability
In this post, we will discuss PV power variability and the need for high-frequency PV production data. High frequency PV power variability (high magnitude, minute-to-minute changes in PV system production) can create some of the most significant grid integration challenges.
As suggested by the image above, transient clouds are the predominant source of high frequency PV power variability. And with considerable effort, translating cloud cover into power variability by taking into account such factors as cloud speed, cloud size, cloud height and cloud lensing (where the sun’s rays are momentarily magnified by cloud edges) is now possible.
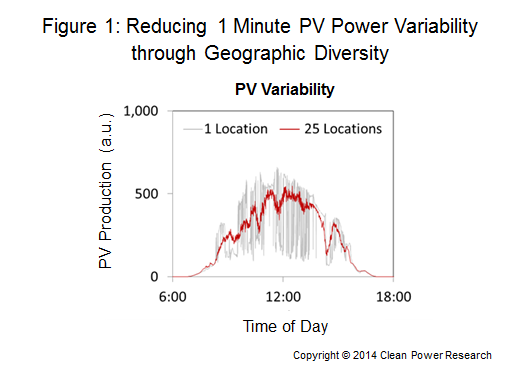
But what about the aggregate effects of multiple PV systems on a single distribution feeder, or a single transmission line? As shown below in Figure 1, summing power production from PV systems located across a wide geographic range can lead to substantial reductions in PV power variability.

Grid Integration Data Challenges
Accurate high frequency PV production datasets are required by grid operators for the following tasks:
- Scheduling and acquisition of load following and regulation resources
- Designing transmission and distribution systems to accommodate voltage fluctuations
- Operation of transmission and distribution systems using real-time data
- Development of integrated resource plans for scenarios with high PV-penetration
Historically, a good source for high frequency PV production data has not been available. While utilities could capture this data from system metering, only a small fraction of PV systems have been installed with production meters that are accessible to the utility. This makes it quite difficult to capture the geographic and system design diversities of an actual PV fleet.
As an alternative, PV fleet production can be successfully modeled given current databases of PV system specifications. Often these specifications are gathered during the incentive or interconnection application process (e.g., using PowerClerk®, as has been done by the California Solar Initiative, and by investor-owned and municipal utilities across the United States). Once known, these PV system specifications can be combined with high-frequency (1-min) irradiance data and PV modeling capabilities to produce sub-hourly, high-frequency PV production datasets.
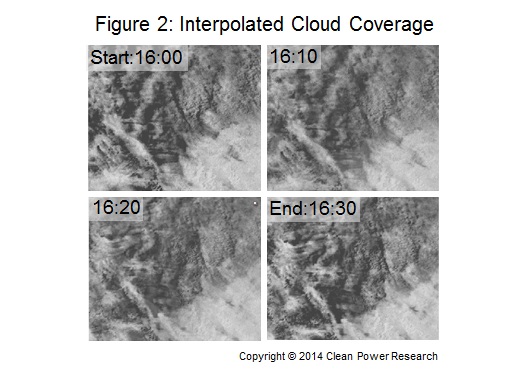
High-frequency irradiance data, however, is not easy to obtain. To solve this challenge, Clean Power Research has developed cloud vector analysis techniques and massively parallel computational architectures to generate 1-minute temporal resolution irradiance data from satellite images taken every 30 minutes. Figure 2 is a grey-scale image (clouds are white) illustrating the results from a cloud vector motion analysis that advance cloud position and cloud morphology in 1-minute steps (10-minute mid-points are shown).

As seen above, Clean Power Research’s cloud vector analysis methods make it possible to interpolate cloud coverage between two known reference points for historical production. Alternatively, these methods can be used to extrapolate cloud coverage forward in time for production forecasting (data not shown).
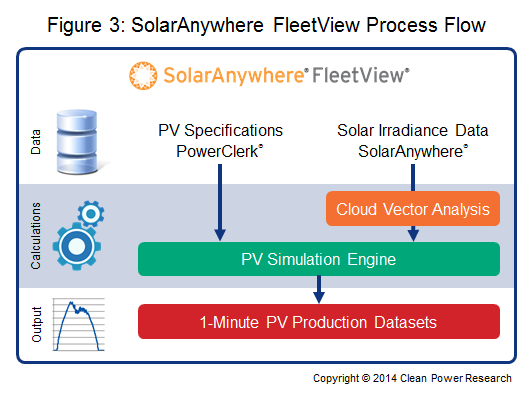
Figure 3 provides a visual outline of the process described above for producing sub-hourly PV production datasets using SolarAnywhere® FleetView®. FleetView integrates SolarAnywhere irradiance data and PV fleet system specifications obtained from PowerClerk (and other sources) to generate PV production datasets.

Using FleetView, Clean Power Research has generated sub-hourly, high frequency PV production datasets for PV fleets with more than 10,000 PV systems for clients such as Duke Energy and Black & Veatch. Similarly, Clean Power Research currently produces a 1-minute PV fleet production forecast for Sacramento Municipal Utility District (SMUD).
Having demonstrated the ability to provide sub-hourly PV production datasets, our next post will focus on how these datasets can be used to estimate the cost to utilities of acquiring increased regulation resources.
