
As large-scale solar development extends to traditionally unconventional areas, the need for quality solar resource data follows. This is especially true in high-latitude areas that experience strong variation in day lengths depending on the season of the year—like Alaska and the Nordics.
SolarAnywhere provides high-latitude irradiance and weather data from +/-60 to +/-80 degrees in the form of Typical Meteorological Year (TMY) and Average Year Summary (AYS) datasets suitable for basic solar prospecting and design. Like data in our primary coverage regions, we provide metrics on uncertainty validated against a network of ground stations.
Data Fields, Resolutions
SolarAnywhere High-Latitude Basic Irradiance and Weather data is available as a TDY or TGY Typical Meteorological Year (TMY) file, or in Average Year format. The dataset provides a 60-minute, 10 km resolution compatible with basic PV design and yield requirements.
Our datasets include essential irradiance and weather fields such as Global Horizontal Irradiance (GHI), Direct Normal Irradiance (DNI), Temperature and Wind Speed at 10 meters.
Elevation (Horizon Shading) files may also be requested and downloaded for high latitude locations.
How to Access
SolarAnywhere’s High-Latitude Basic Historical Data is currently offered through our Typical Year+ license, with access through the SolarAnywhere online data portal or SolarAnywhere API.
You may also contact our support team for single location access.
Access via the SolarAnywhere Website
High-latitude data files are available for instant download through the SolarAnywhere data website with access to a Typical Year+ license.
To get started, follow the steps below.
- Select a location for download by searching for the site location or by selecting a pin location on the map. You may also select an existing location from your Location List. Up to 10 locations can be selected from the map or Location List for downloading multiple files at once.
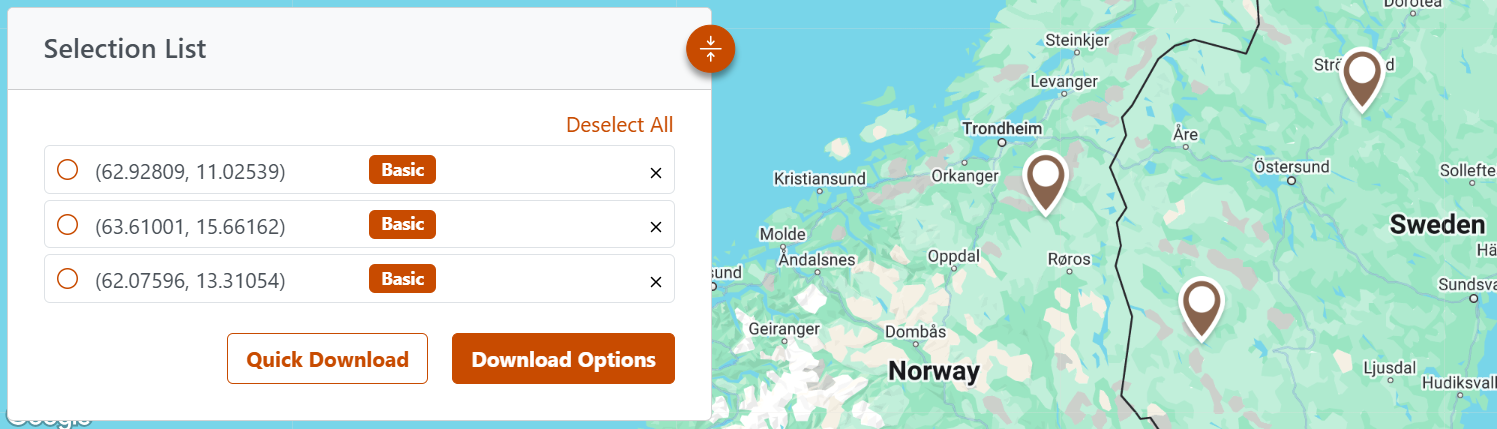
Figure 1. Selecting Locations on the SolarAnywhere Data Website
- From the Selection List window, click “Download Options.”
- In the Download window, check the box next to “TGY”, “TDY”, “Average Year Summary,” and/or “Elevation (Horizon Shading)” under “Data file Types.”

Figure 2. Data File Types in the “Download Options” Window
- Select the preferred data file type, output format, data version, missing data fill and datasets to include in the file. For high latitude locations, users may only request datasets for all sky irradiance, wind speed (10m), and surface temperature.
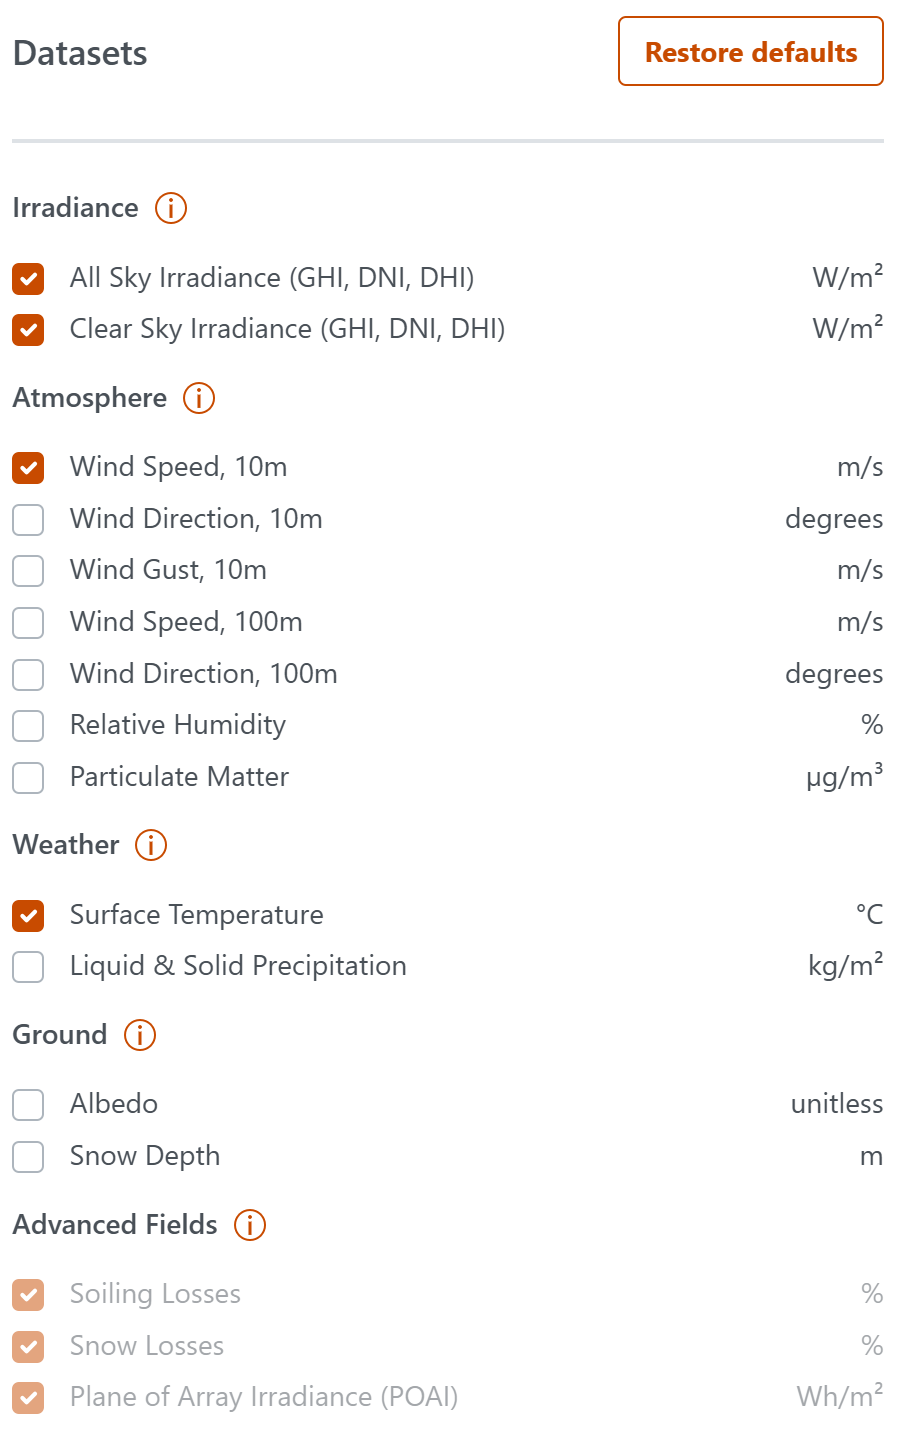
Figure 3. Datasets selection in the “Download Options” window.
- When finished, click “Download” to begin the file download process.
- Navigate to the Downloads tab to download and view the file.
Access via the SolarAnywhere API
High-Latitude Basic Historical Data is available through the SolarAnywhere API. Visit this page of our API documentation to see an example High-Latitude Basic Historical Data request.
Basic Data
Native spatial resolution of satellites in high latitudes above 60 degrees can vary from 30 –100 km. This is much coarser than satellites under middle latitudes which are typically 1 – 2 km in spatial resolution1. In order to overcome practical difficulties of such coarse resolutions, we optimally blend and downscale to a final resolution of 10 km for users.
Other datasets for auxiliary fields like albedo, wind and particulate matter may not be available or lack comparable validation to other regions. Unfortunately, coverage is not as comprehensive.
For these reasons, we must be transparent about the quality our data and not overstate its accuracy—in fact, this is true for any data provider as developing and operating PV systems in high latitudes is an active area of research2.SolarAnywhere high-latitude datasets our current year release are a first offering and we intend to improve it over time as technologies advance.
If you would like to provide quality ground data to support our research, please partner with us.
Methodology & Validation
Among other data sources, SolarAnywhere uses data from polar-orbiting satellites to prepare high-latitude irradiance data, which provide better viewing angles due to their orbital paths than geostationary satellites used for middle and low latitudes.
We identified a series of existing irradiance and satellite sources and blended them with our clear-sky model (among other modifications) to create an industry-leading historical data product.
The figures below illustrate the performance of individual sources against one of the validation sites. We show a scatterplot of the raw source against ground truth, and the relative Mean Bias Error (MBE) of each of the sources, month by month.
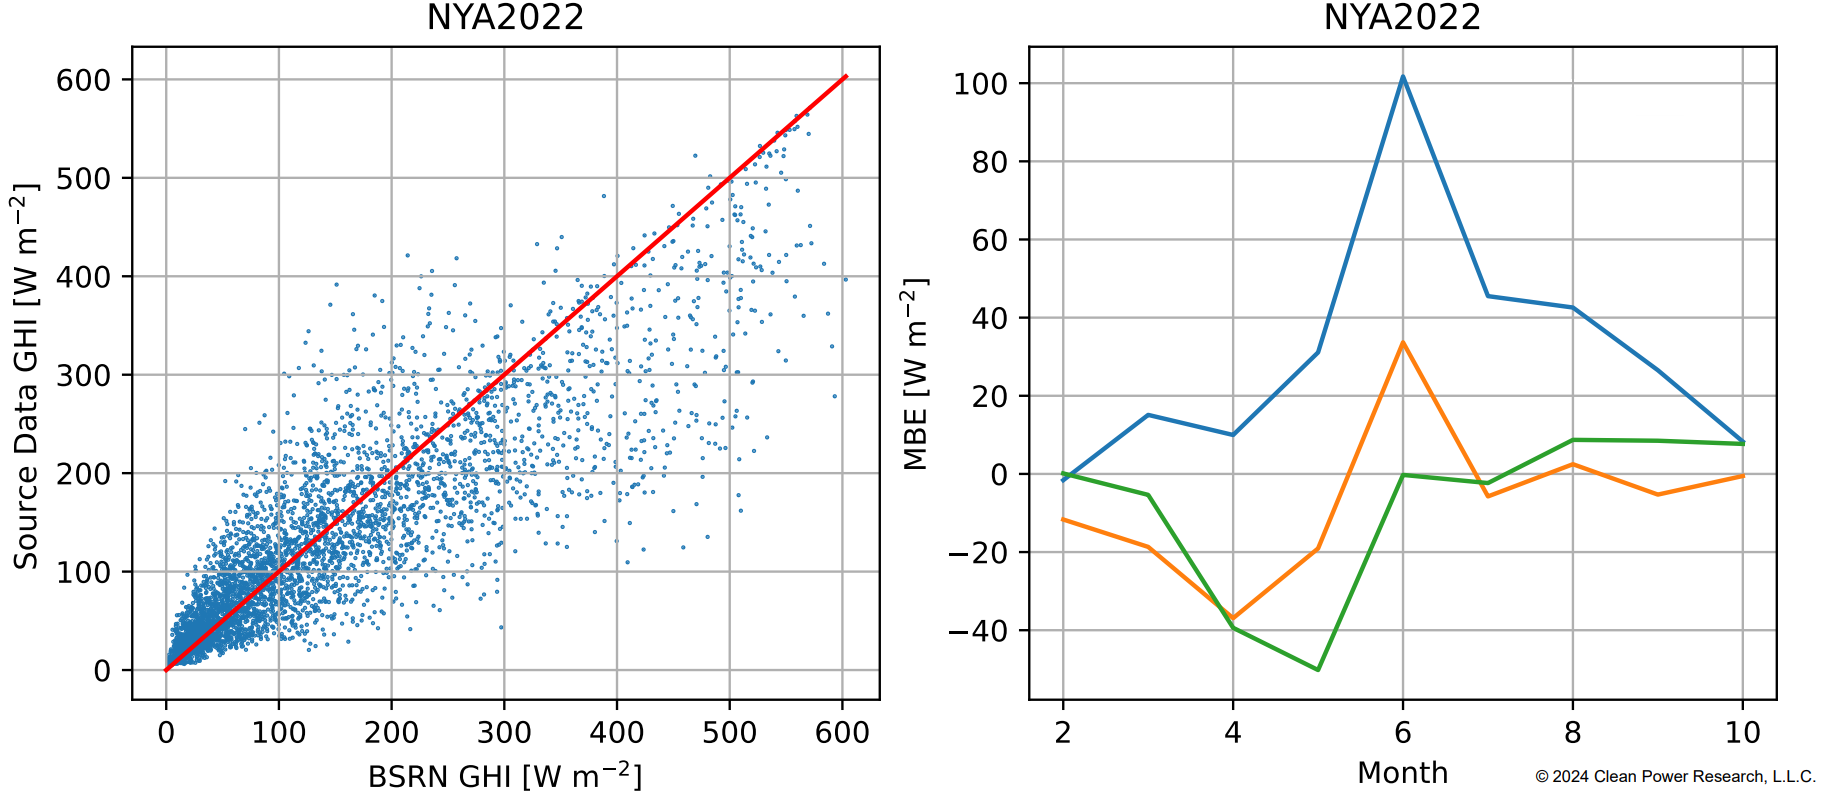
Figure 1: Example of Characterizing Variability of Source Data.
Consistent with our primary data coverage regions, we validate against ground stations to give users a sense of accuracy of the data. The following figure displays the network of Baseline Surface Radiation Network (BSRN)3 stations used in validation, with summary statistics in the following table.
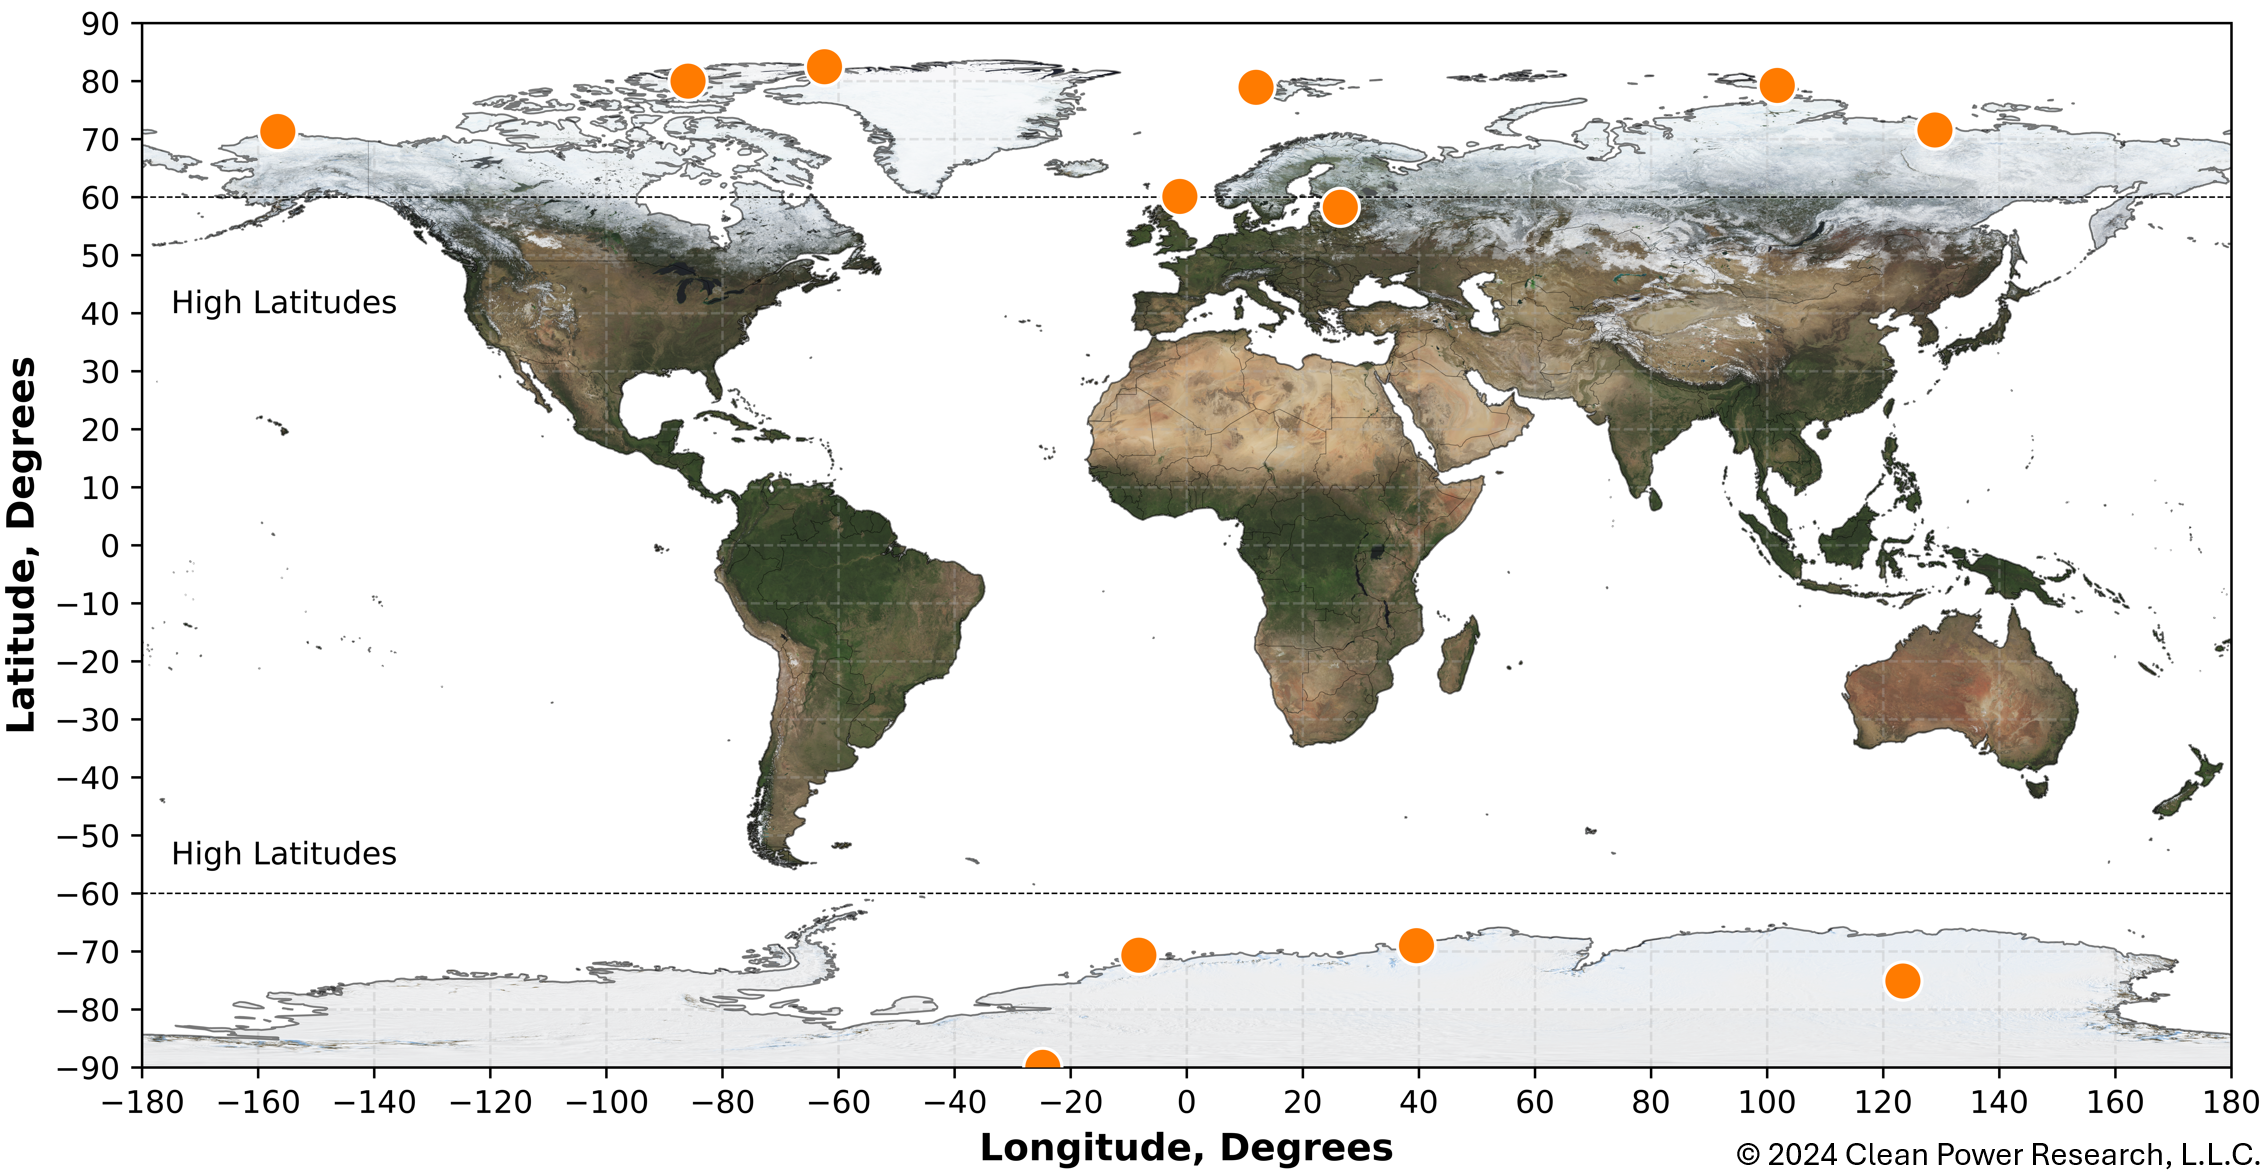
Figure 2: SolarAnywhere High Latitude Validation Sites
Table 1: SolarAnywhere High-Latitude Uncertainty, Global Horizontal Irradiance (GHI)
In the figures below, we publish our accuracy metrics against the BSRN by individual site. By dynamically combining data sources with unique techniques, we play to the advantages of each model and create an ensemble of data with lower error metrics than any original source. As a benchmark, ERA5 performance is shown against the SolarAnywhere blend.
In addition, we encourage spatial consistency (rather than “tuning” to particular stations) by cross-validating datasets. The SolarAnywhere blended model often has the lowest error at each site, though not exclusively.


References
1 SolarAnywhere Geographic Coverage, 2024. Clean Power Research. https://www.solaranywhere.com/support/geographic-coverage/.
2 PVPMC High Latitude Workshop, March 2024. https://pvpmc.sandia.gov/workshops-and-pubs/workshops/2024-high-lat-pv-workshop-pitea/.
3 Baseline Surface Radiation Network (BSRN). https://bsrn.awi.de/.