
SolarAnywhere® time-series data is available for historical, real-time and forecasted time periods with a SolarAnywhere Sites, Forecast or SystemCheck® license.
Historical time-series data can be downloaded from the SolarAnywhere data website or requested via API with access to a Sites license. This data can be requested in 15-minute, 30-minute or hourly resolution. The period available and the spatial resolution are dependent upon the geographic data region.
How to Access
Time-series datasets are currently offered through our Sites Licenses, with access through the SolarAnywhere online data portal or SolarAnywhere API.
Access via the SolarAnywhere Website
Time-series files are available as one of the data file types in the Download Options menu when downloading SolarAnywhere data from the Map interface. Users may request these files and generate output in two distinct file formats: SolarAnywhere and TMY3.
To download a time-series file:
- Select a location for download in the Location List or by selecting a pin on the map. Multiple locations may be selected and will be added to the Selection List at the bottom left corner of the screen. You may need to activate or upgrade the location to access time-series data.
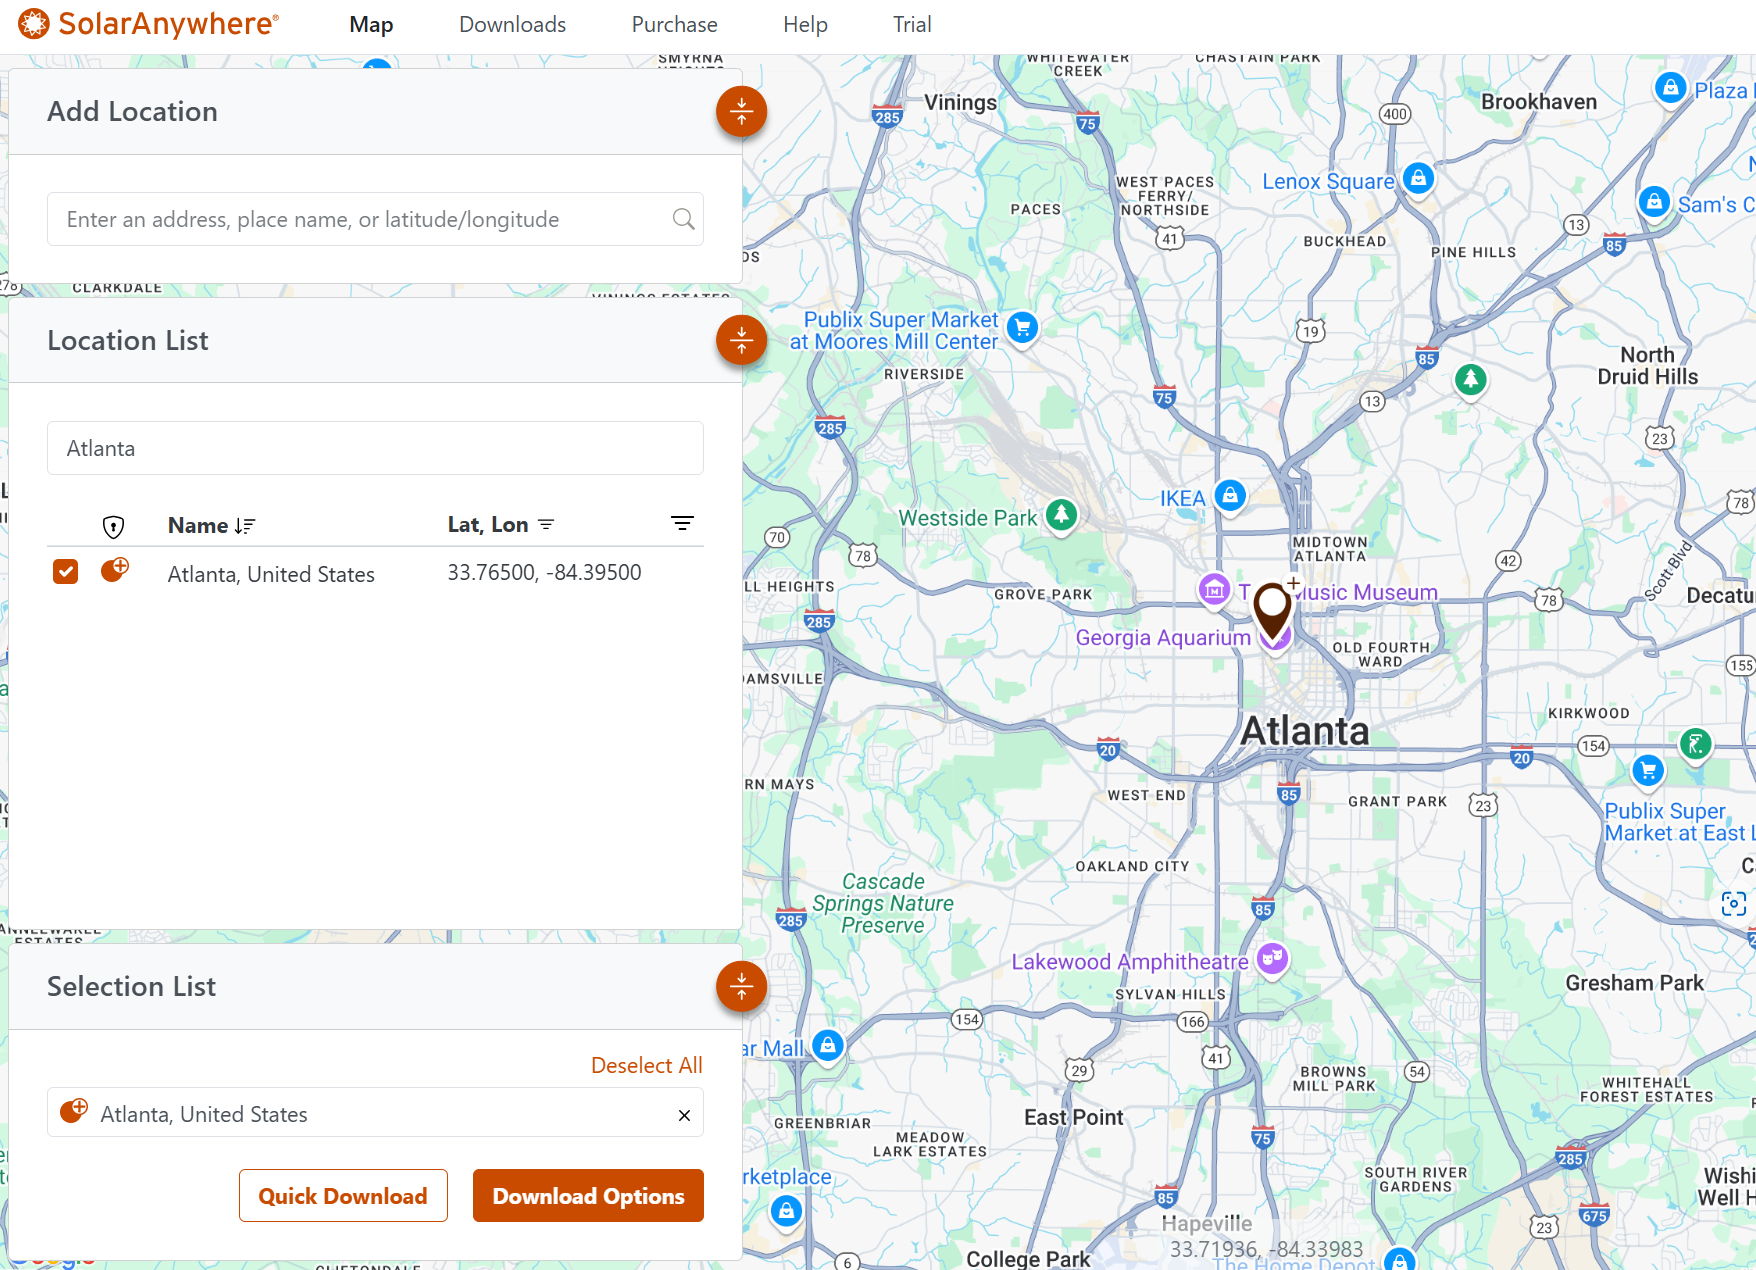
Figure 1. Selecting a Sites Location on the SolarAnywhere Data Website
- Click “Download Options.”
- Choose the “Time Series” option under “Data File Types.”
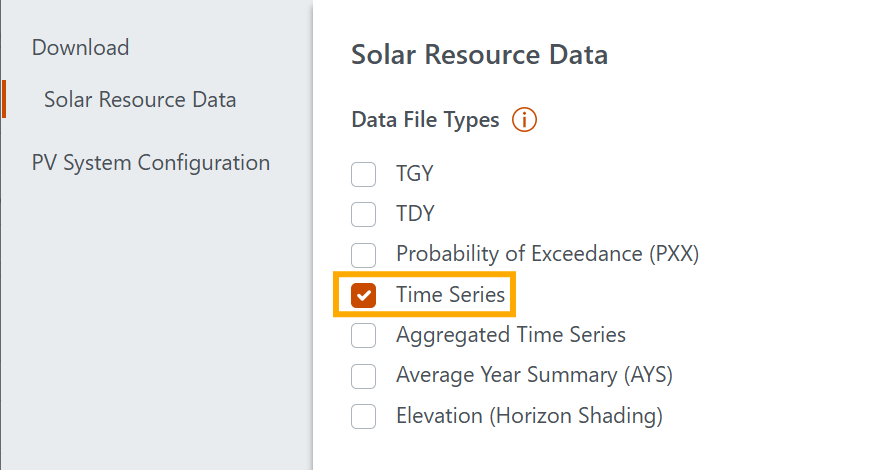
Figure 2. Time Series Settings on the SolarAnywhere Data Website
- Select the file settings and desired datasets. When finished, click “Download.”
- Navigate to the Downloads page to download and view the file:

Figure 3. Downloads Tab on the SolarAnywhere Data Website
Users can demo time-series files with SolarAnywhere Public.
Access via the SolarAnywhere API
Time-series data can also be requested through the SolarAnywhere API. Visit this page of our API documentation to access example time-series requests. This process is demonstrated in the following instructional video:
Using SolarAnywhere Time-series Data
Historical time-series data is recommended for comparing measured data for resource assessment and performance analysis in addition to calculating PV system losses. Using time-series data in snow-loss modeling can help reduce the occurrence of over or underestimation of losses due to snow cover on PV panels. Additionally, time-series data may be more accurate for modeling site-specific soiling losses due to the cumulative nature of dust and contaminants on PV panels.
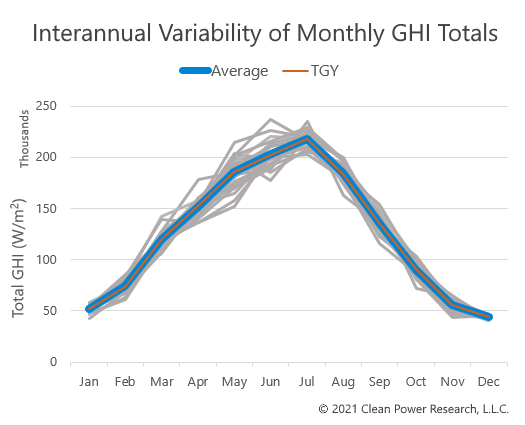
Historical time-series data is the most bankable data for PV project financing and asset management. It’s used to determine the interannual variability of the solar resource, as well as expected irradiance totals at various probability of exceedance levels.
Lastly, SolarAnywhere historical time-series data can be tuned to high-quality, ground-measured data to further reduce resource uncertainty. To learn more, visit the site-adaption studies page.
Site-Adaptation StudiesUsers can demo time-series data with SolarAnywhere Public.
Calculating Interannual Variability
Interannual variability can be calculated as the coefficient of variation. The coefficient of variation is the ratio of standard deviation of annual irradiances for the full SolarAnywhere time-series dataset divided by the mean of annual irradiances (as shown in the equations below).
Where represents the number of full years in the SolarAnywhere time-series dataset, and represents the annual total irradiance from each year in the full SolarAnywhere dataset, and represents the last full year of data available in the full SolarAnywhere time-series dataset.
References
1 SolarAnywhere versions 3.4 and prior: At midnight UTC on the 16th of each month, SolarAnywhere data from 1 month prior is re-generated using the SolarAnywhere historical model and archived. Once data is archived, it will not change within the data version. For example, at midnight UTC on the 16th of July, the data for June will be re-generated and archived with historical models.
SolarAnywhere versions 3.5 and later: At midnight UTC on the 6th of each month, SolarAnywhere data from 2 months prior is re-generated using the SolarAnywhere historical model and archived. Once data is archived, it will not change within the data version. For example, at midnight UTC on the 6th of July, the data for May will be re-generated and archived with historical models.
Utilize the Irradiance Observation Type irradiance and weather data field in the SolarAnywhere output format or request it in your API requests to understand when this transition from the real-time model to the historical model occurs in your data.