
The map overlays provide visualizations of trends and extreme values for various weather and irradiance data through the SolarAnywhere online data portal. Access to SolarAnywhere map overlays are available through all license types, including our Public license. PV project developers can use these overlays to understand solar resource and weather patterns, identify instances of extreme weather, and assess risk potential based on annual and monthly average trends.
Datasets
Available map overlays include spatial resolution grids and select weather and irradiance data. The spatial resolution grids correspond to the satellite imagery used for determining irradiance data.
Solar resource and weather data overlays are either monthly or annual. The slider for monthly values goes from January through December. Annual datasets can be adjusted from 1998 up to 2024, depending on the dataset. The table below provides a summary of the available solar resource and weather map overlays. If you’d like to learn about SolarAnywhere weather-data field sources, visit Weather Data Sources.
Using SolarAnywhere Map Overlays
Map overlays can be selected from the Map page of the SolarAnywhere data website.
- Navigate to the Map page.
- Click the Map Overlays button in the top right corner of the map interface.
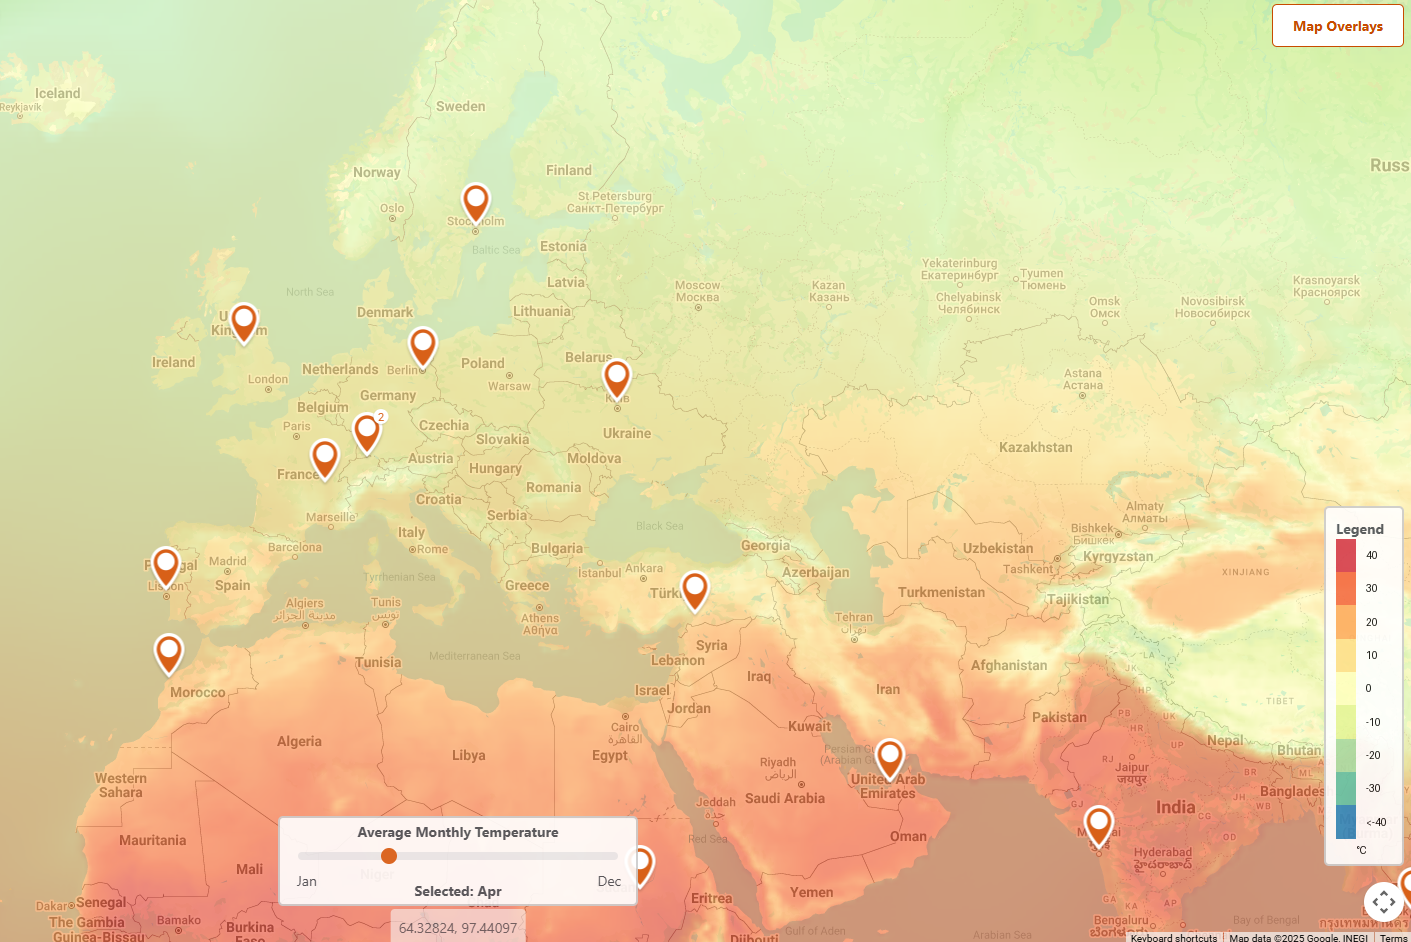
Figure 1: SolarAnywhere Data Website showing Map Overlay
- Select the desired overlay and click Apply. Only one overlay may be active at a time.
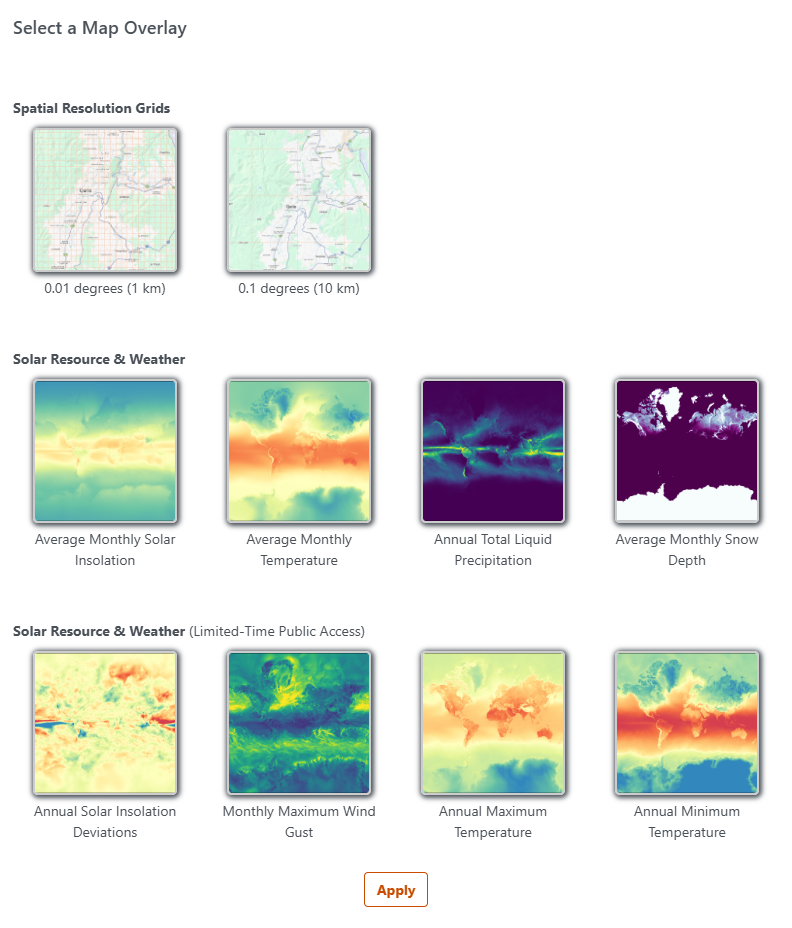
Figure 2: Map Overlay Selection Popup
- Once the overlay has been applied, use the slider at the bottom to adjust the month or year of the dataset.