Introduction
SolarAnywhere PXX files make it easier and faster to calculate your project’s PXX energy yield. The “XX” refers to the probability that the level of irradiance will be exceeded in a given year. You specify the probability (e.g., P90) and SolarAnywhere returns a representative weather file with 8760 hourly values that can be imported into any PV modeling tool. PXX data is available in the web user interface and the API, and is included with Sites (time-series) licenses.
SolarAnywhere PXX files are created using an improved method for calculating probability of exceedance that better represents asymmetric irradiance distributions and weather risk than standard approaches. Higher quality data reduce the risk of unnecessarily conservative or costly financing.
Download PXX Data Sample (CSV File)How to Access
Probability of exceedance (PXX) datasets are currently offered through our Sites Licenses, with access through the SolarAnywhere online data portal or SolarAnywhere API.
Access via the SolarAnywhere Website
Probability of exceedance (PXX) data is available as one of the data file types in the Download Options menu when downloading SolarAnywhere data from the Map interface. Users may request these files and generate output in two distinct file formats: SolarAnywhere and TMY3.
To download a PXX file:
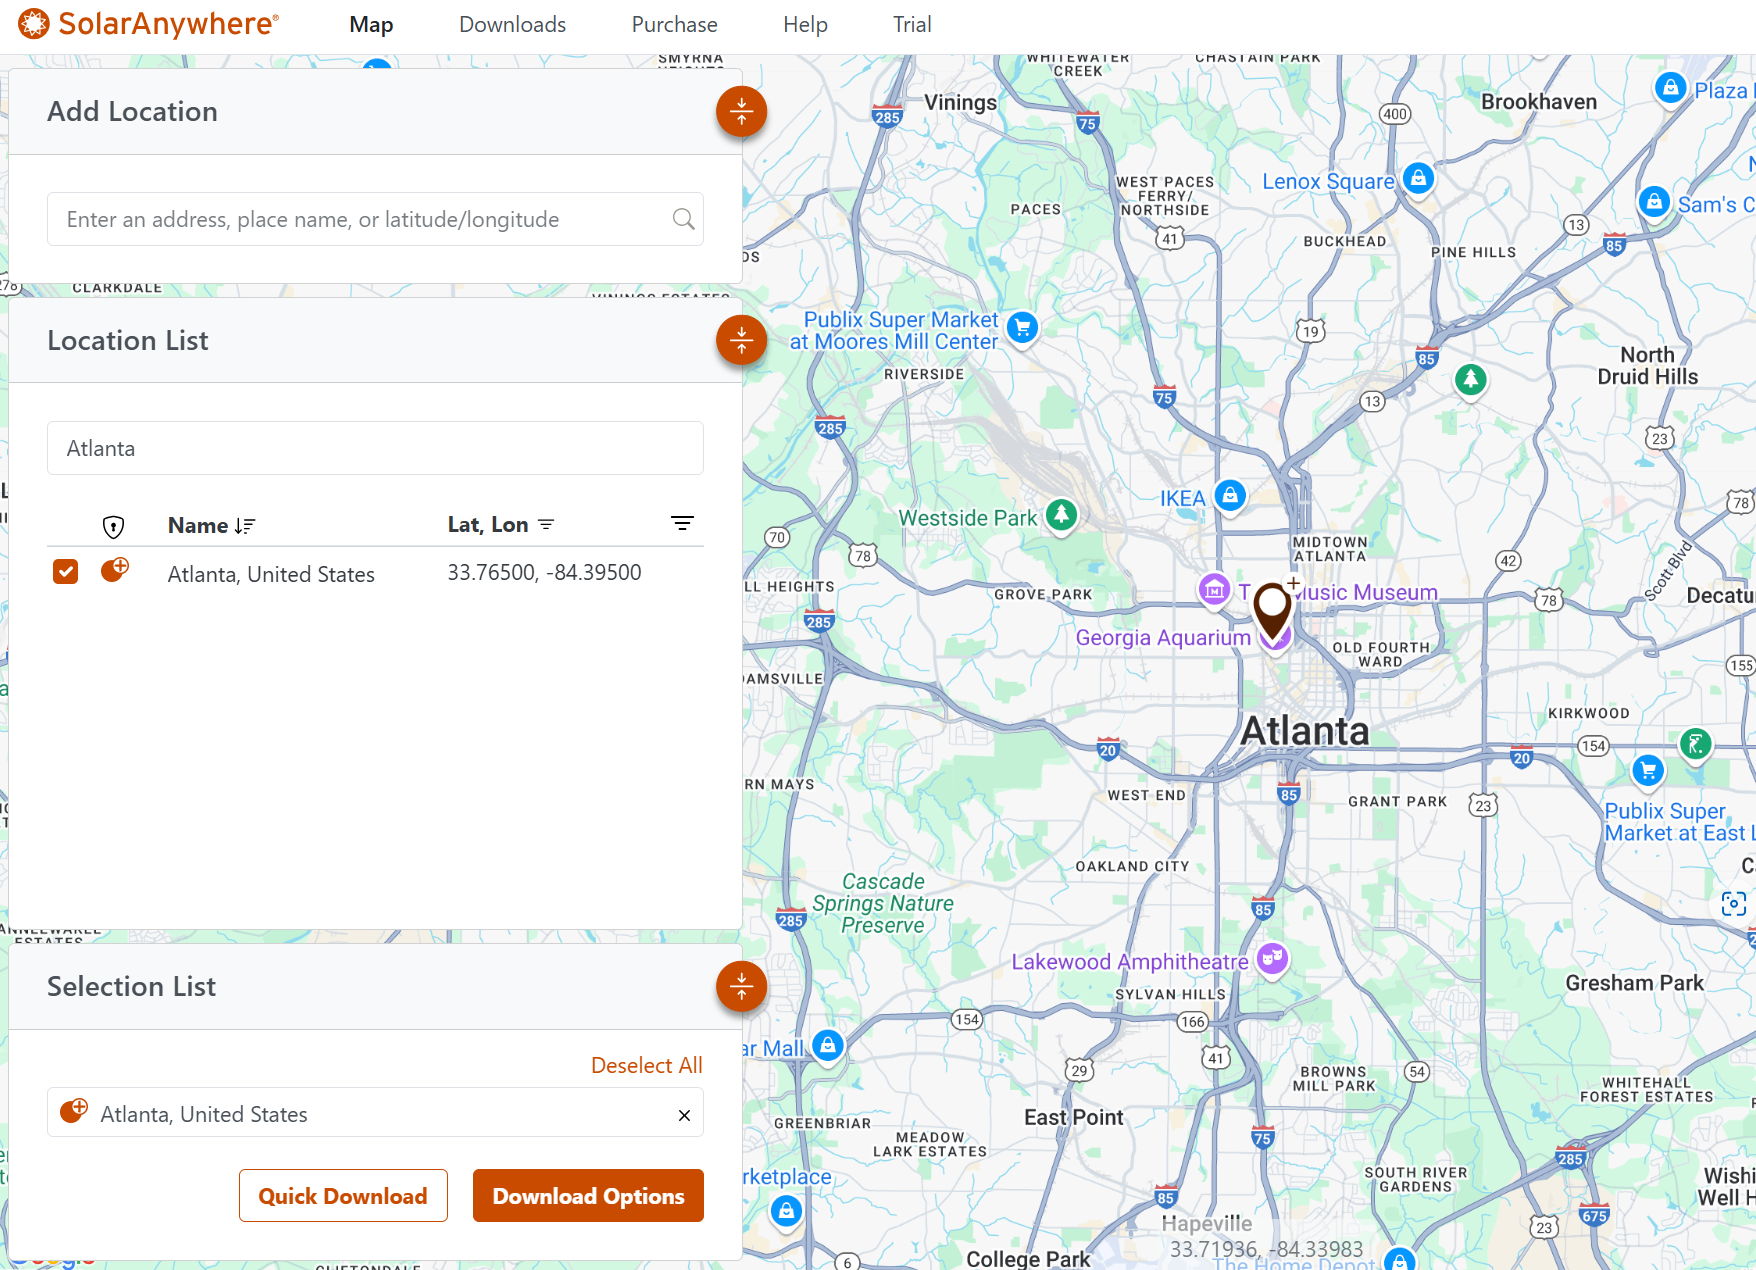
- Select a location for download in the Location List or by selecting a pin on the map. Multiple locations may be selected and will be added to the Selection List at the bottom left corner of the screen. You may need to activate or upgrade the location to access PXX data.
- Click “Download Options.”
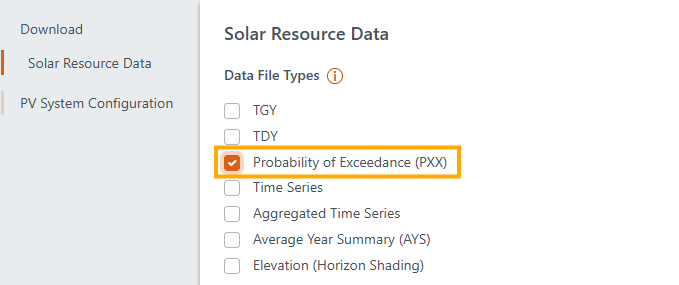
- Choose the “Probability of Exceedance” option under “Data File Types.”
- Select the file settings, including the Probability of Exceedance value, and desired datasets. When finished, click “Download.”
- Navigate to the Downloads page to download and view the file:
Users can demo PXX files with SolarAnywhere Public.
Access via the SolarAnywhere API
Probability of exceedance data can also be requested through the SolarAnywhere API. Visit this page of our API documentation to access an example PXX request.
Methodology
To create a probability of exceedance file, we first need a distribution of annual irradiance. SolarAnywhere offers an accurate, consistent dataset back to 1998 in North America, approximately 27 years and growing. That’s longer than a typical 20-year power purchase agreement. Unfortunately, the period of record is insufficient to create a satisfactory distribution.
The limitations of standard methods led Dr. Richard Perez to propose an improved method in 2012, which we call here the partial-year method. The partial-year method was presented at the PV modeling workshop in 2017.1 To create an enlarged dataset, GHI is averaged over four-month segments for each year. The four-month averages are used to construct all possible year combinations. The number of combinations is equal to the number of years considered cubed, which is enough to establish the PXX target. In the final step, the algorithm selects months that will create a file with the desired annual irradiance target and a reasonable monthly profile.
SolarAnywhere uses the partial-year method to create probability of exceedance files. The period is consistent with SolarAnywhere TGY datasets so they may be compared directly.
Comparison to other methods
There are many approaches to calculate probability of exceedance, and it’s important to understand the approach taken and how that relates to the specific purpose. Here we compare three methods: empirical, normal (Gaussian) and partial year.
The most direct application of the data is the empirical cumulative distribution. Each observation is assumed to be equally likely and sorted from lowest to highest. Probabilities (y) are assigned to each observation by y = (i – 0.5)/m where i is the observation, and m is the number of observations. The probability of exceedance is 1 less the probability. In short, if we have 20 years of annual irradiance values, the lowest year is the P97.5, the second lowest year is the P92.5, and so on. P99 is undefined because the data to support the estimate do not yet exist. The downside of using an empirical distribution is that many samples (>>20) are needed for the true shape of the distribution to emerge.
As a result, a common practice is to define a normal distribution by calculating the mean and standard deviation of the annual irradiance totals. As an example, in a 2010 ASES publication, 8 years of SolarAnywhere data were used to estimate interannual variability across the continental U.S.2 The problem with assuming a normal distribution is that solar irradiance does not, as a general assumption, fit a normal distribution, which can skew results.3
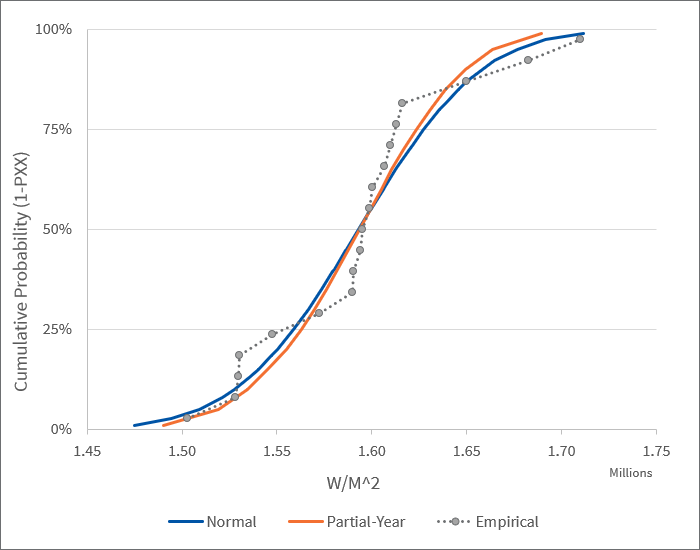
To explore the topic further we analyzed 221 locations coincident with the NSRDB TMY3 class 1 weather stations across the U.S.4 SolarAnywhere was used to estimate the annual irradiance for each location. Next, the three distributions were calculated for each location. An example for an arbitrary location is shown in Figure 4.

Fig. 4: Cumulative Distributions for Empirical, Partial-year and Normal Probability of Exceedance Methods for the Knoxville McGhee Tyson Airport
The data are too sparse for the empirical distribution to provide satisfactory percentiles. In addition, the P99 is undefined, which may not be acceptable for some parties.
However, with a sufficiently large sample of sites, the empirical distribution can be used as a reference to assess the fit of the normal and partial-year distributions. The average bias for a distribution with a good fit should be low. For project finance, it’s critical to estimate the left tail of the distribution, so the analysis examined the PXXs associated with the lowest and second lowest irradiance years for the period 1998 through 2016 (P97.4, and P94.1).
The analysis revealed that both the normal and partial-year distributions have a low average bias (less than +/- 0.2% mean bias error for both methods and both PXXs). Low bias is critical. A poor fitting distribution has the potential to systemically under- or over-represent the resource.
On an individual site basis, the differences between the empirical distribution and the two other methods were found to be below +/- 1% for half of the sites in the analysis (the interquartile range) for both the lowest and second lowest irradiance years. The results are consistent with the expected sampling error (see Uncertainty).
P99 was also examined. No source exists for an empirical reference of P99. However, we can do several sanity checks. Annual totals less than 9% below the site-mean were observed only once across the 221 sites. Other methods found that P99 falls between -4 and -8% within the continental U.S.5 Therefore, P99 estimates below -9% are unlikely to be a good characterization of the solar resource. Almost 5% of the P99 estimates that assume a normal distribution fell in the range of -9 to -12%. The partial-year method was two-thirds less likely to yield erroneously low P99 estimates.
The advantage of the partial-year method over the assumption of normality is the proper accounting of the dissymmetry inherent to the data. The normal distribution uses the root sum square of the distance to the mean to calculate the standard deviation. Since the distribution is symmetrical, an unusually high irradiance year can produce a distribution that appears to overestimate the likelihood of a low irradiance year. An example of this is seen in Figure 4. The partial-year method mitigates this issue by using combinations of 4-month averages from the dataset rather than statistics to create the distribution.
Uncertainty considerations
SolarAnywhere is the most accurate satellite-derived solar database.6 SolarAnywhere’s consistency across time and space is a critical advantage compared to ground-based measurement for the purposes of variability studies. Indeed, these characteristics were a key motivator for its development and enabled SolarAnywhere to identify an unreported calibration issue at one of the nations most trusted ground reference stations.7 Earlier estimations of interannual variability leveraged the unique capability.8
Unfortunately, a calculation of uncertainty is not possible because a statistically significant reference dataset does not exist. Very few high-quality, well-maintained ground stations have more than two decades of record.
The PXX files do not include additional modeling uncertainties in their construction. In that way developers and independent engineers have control over and full transparency into the uncertainties applied to energy estimations. In addition, the results are reproducible.
The error in the PXX estimate is a function of the number of observations and the probability level (the XX). The mean of a distribution can be estimated with fewer observations than the P90. A statistical study of sampling error of normal distributions estimates that half of P90’s derived from 19 years of data will be within +/- 1% of the true P90. The 95% confidence interval is +/- 2.0% (σ = 1.2%).9
The 19-year period of record is expected to exhibit less variability than the 30 years minimum that would be typical for a climatological study. Notably, the period of record does not include any very large volcanic explosions (Volcanic Explosivity Index 6 and above). Such explosions occur at a rate of several per century and therefore influence inter-annual variability around the P99 level. A study of the last major explosion, the Philippines’ Mount Pinatubo in 1991, found peak DNI at four stations in the western USA fell 10-20% from a year prior, but that the impact on GHI was greatly attenuated by a corresponding increase in diffuse irradiance.10
Climate change is another concern. The impact of climate change on future solar energy production cannot be estimated with historical data.
SolarAnywhere probability of exceedance files represent the inter-annual variability of the SolarAnywhere dataset. While the SolarAnywhere database is an excellent long-term record, additional uncertainties should be considered at the tail of the distribution, e.g. P99.
SolarAnywhere PXX data
SolarAnywhere PXX files make it convenient to calculate your project’s PXX energy yield. SolarAnywhere uses an improved method that shows negligible average bias while producing more realistic PXX estimates than observed annual totals alone. In addition, SolarAnywhere PXX data are two-thirds less likely to yield erroneously low P99 estimates than those based on a normal distribution, reducing the risk of unnecessarily conservative financing.
References
1 J. Dise, “Advances in Long-Term Solar Energy Prediction and Project Risk Assessment Methodology Through Non-Normally Distributed Probabilities of Exceedance,” 8th PVPMC, vol. 2017.
2 S. Wilcox, C. Gueymard, “Spatial and Temporal Variability of the Solar Resource in the United States,” ASES Solar 2010.
3 See for example: A. Dobos, P. Gilman, M. Kasberg, “P50/P90 Analysis for Solar Energy Systems Using the System Advisor Model,” National Renewable Energy Laboratory, Presented at the 2012 World Renewable Energy Forum; G. Kimball et al., “Improved model of solar resource variability based on regional aggregation and climate zones,” IEEE WCPEC-7 2018.; J. Dise, “Advances in Long-Term Solar Energy Prediction and Project Risk Assessment Methodology Through Non-Normally Distributed Probabilities of Exceedance,” 8th PVPMC, vol. 2017.
4 https://www.nrel.gov/docs/fy08osti/43156.pdf
5 G. Kimball et al., “Improved model of solar resource variability based on regional aggregation and climate zones” IEEE WCPEC-7 2018.
6 Based on each provider’s self-reported validation, where available. See Validation for more information about SolarAnywhere validation.
7 Perez, R., J. Schlemmer, A. Kankiewicz, J. Dise, A. Tadese & T. Hoff, “Detecting Calibration Drift at Ground Truth Stations—A Demonstration of Satellite Irradiance Models’ Accuracy,” IEEE PVSC-44, 2017.
8 S. Wilcox, C. Gueymard, “Spatial and Temporal Variability of the Solar Resource in the United States,” ASES Solar 2010.
9 See G. Kimball et al., “Improved model of solar resource variability based on regional aggregation and climate zones,” IEEE WCPEC-7 2018. Statistics courtesy G. Kimball.
10 Rosenthal, A.L., Robert, J.M., “Effects of the Mount Pinatubo eruption on solar insolation: Four case studies,” Sandia National Laboratories, U.S. Department of Energy, 1993.


