Real-time, time-series data for the trailing 45 days can be downloaded from the SolarAnywhere portal via the SystemCheck Monitoring Dashboard with a SolarAnywhere® SystemCheck® license. Users can easily visualize, access and export SystemCheck real-time irradiance data directly from this user interface (UI).
At each location logged on the dashboard, users will have access to the following data:
2 For extended support, please contact us. See contact us.
Using the Dashboard
To get started, navigate to the SolarAnywhere portal, and click on the Monitoring tab. If you don’t see this option, this means this feature hasn’t been enabled on your license. To request the activation of the dashboards, please contact us.
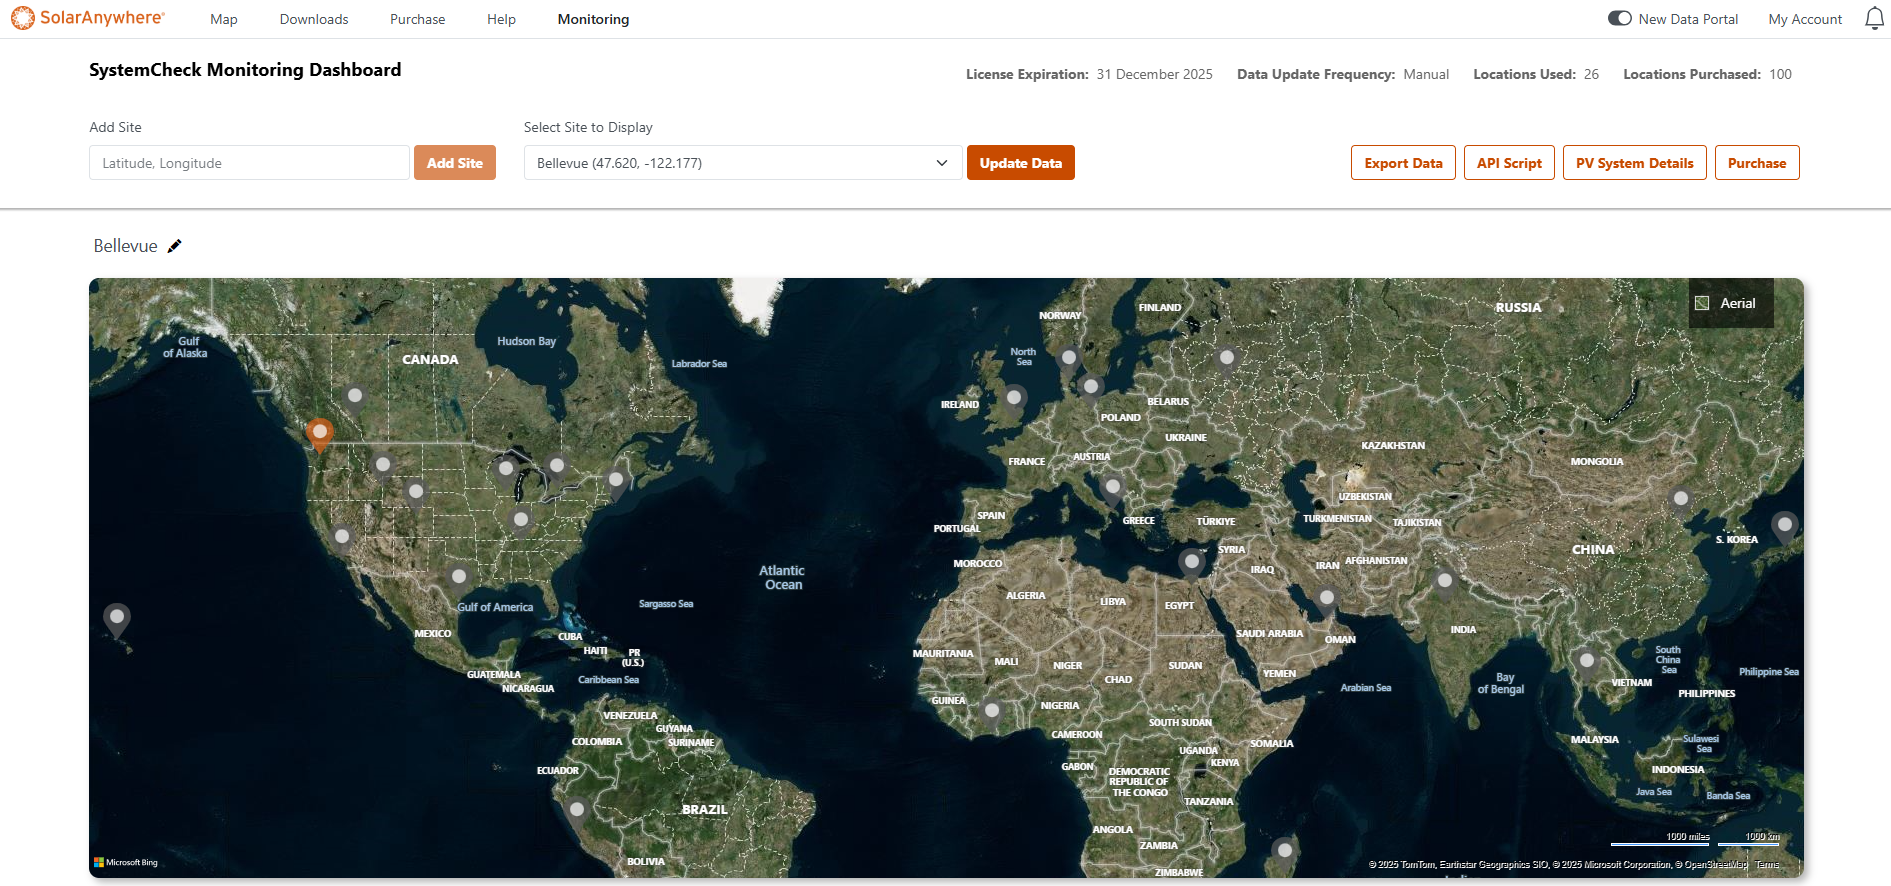
You can begin adding new dashboard locations through a variety of methods. You can either click on the location of interest on the map and then select “Add Site,” or you can enter the coordinates at the top of the page and choose “Add Site.” Outside of the UI, locations from API requests are also updated on the dashboard hourly. A pin will be added to the map at the specified latitude and longitude for valid locations. Note that upon activation of the dashboard, the dashboard will be populated with your purchased locations. Both requests made through the API and UI contribute to the number of locations used in the dashboard.

Figure 1. SystemCheck Monitoring Dashboard
Above the map interface, there are several options to explore:
- Update Data: Click this button to manually update the data in the dashboard for the currently selected location up to the current hour. Without selecting the Update button, dashboard data is not updated automatically.
- Export Data: Allows users to export any of the data currently displayed in the dashboard in a .zip file containing the selected locations in .csv format. Ensure that you update the dashboard data before exporting!
- API Script: Reveals a Python script that can be used to call the same data as displayed in the dashboards via the SolarAnywhere API. Users can copy these scripts to get a head-start implementing similar API requests.
- PV System Details: Opens an interface that documents the PV System values used to simulate power modeling and plane-of-array-irradiance in the dashboard. At this time, these values aren’t editable in the UI, but you can customize these values in the API.
- Purchase: Purchase up to 5 locations via EPay to use instantly in the dashboard or through the API.

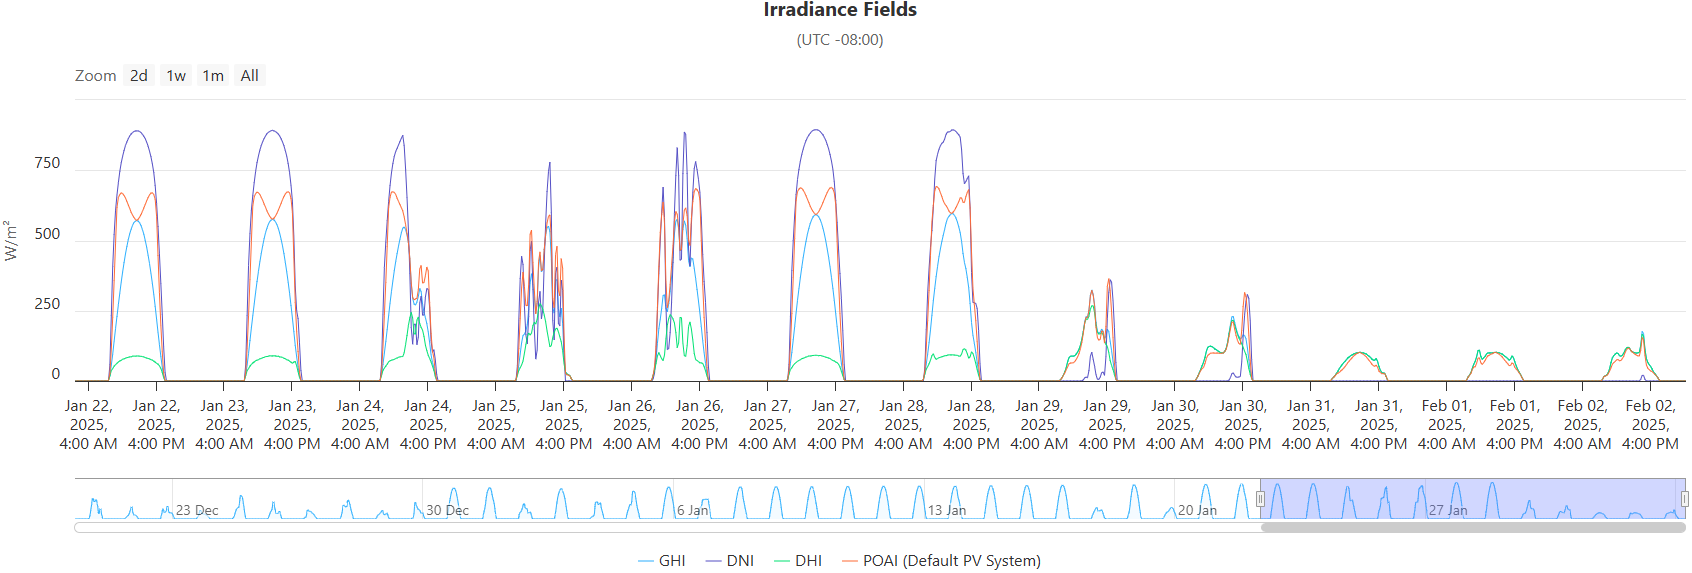
Figure 2. Example Irradiance Chart
Below the map interface, the dashboard displays various interactive charts of irradiance, power, and weather data.
Stay tuned for more updates and enhancements as we continue to innovate and improve SystemCheck. If you have any questions or need assistance with the new feature, our support team is here to help.